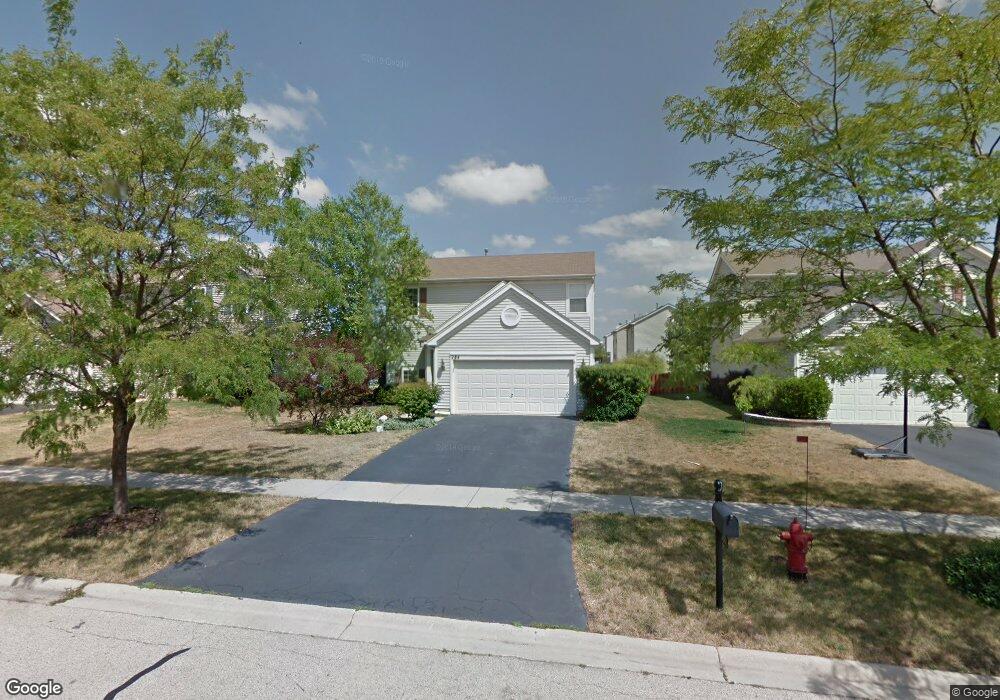
284 Aspen Cir Gilberts, IL 60136
Estimated Value: $343,667 - $392,000
--
Bed
1
Bath
1,390
Sq Ft
$263/Sq Ft
Est. Value
About This Home
This home is located at 284 Aspen Cir, Gilberts, IL 60136 and is currently estimated at $365,167, approximately $262 per square foot. 284 Aspen Cir is a home located in Kane County with nearby schools including Gilberts Elementary School, Hampshire Middle School, and Hampshire High School.
Ownership History
Date
Name
Owned For
Owner Type
Purchase Details
Closed on
Oct 26, 2016
Sold by
Janice Richard T
Bought by
Janice Richard T and Janice Steffanie M
Current Estimated Value
Home Financials for this Owner
Home Financials are based on the most recent Mortgage that was taken out on this home.
Original Mortgage
$184,819
Outstanding Balance
$150,446
Interest Rate
3.87%
Mortgage Type
FHA
Estimated Equity
$214,721
Purchase Details
Closed on
Jul 29, 2011
Sold by
Janiec Richard T and Janiec Georgana
Bought by
Janiec Richard T
Purchase Details
Closed on
Jan 25, 2002
Sold by
The Ryland Group Inc
Bought by
Janiec Richard T and Janiec Georgana
Home Financials for this Owner
Home Financials are based on the most recent Mortgage that was taken out on this home.
Original Mortgage
$142,600
Interest Rate
7.23%
Create a Home Valuation Report for This Property
The Home Valuation Report is an in-depth analysis detailing your home's value as well as a comparison with similar homes in the area
Home Values in the Area
Average Home Value in this Area
Purchase History
| Date | Buyer | Sale Price | Title Company |
|---|---|---|---|
| Janice Richard T | -- | Servicelink | |
| Janiec Richard T | -- | None Available | |
| Janiec Richard T | $178,500 | First American Title Co |
Source: Public Records
Mortgage History
| Date | Status | Borrower | Loan Amount |
|---|---|---|---|
| Open | Janice Richard T | $184,819 | |
| Previous Owner | Janiec Richard T | $142,600 |
Source: Public Records
Tax History Compared to Growth
Tax History
| Year | Tax Paid | Tax Assessment Tax Assessment Total Assessment is a certain percentage of the fair market value that is determined by local assessors to be the total taxable value of land and additions on the property. | Land | Improvement |
|---|---|---|---|---|
| 2024 | $6,409 | $84,711 | $29,314 | $55,397 |
| 2023 | $6,255 | $76,606 | $26,509 | $50,097 |
| 2022 | $6,129 | $70,630 | $24,441 | $46,189 |
| 2021 | $5,948 | $66,431 | $22,988 | $43,443 |
| 2020 | $5,843 | $64,735 | $22,401 | $42,334 |
| 2019 | $5,681 | $62,132 | $21,500 | $40,632 |
| 2018 | $5,530 | $58,312 | $20,178 | $38,134 |
| 2017 | $5,418 | $55,530 | $19,215 | $36,315 |
| 2016 | $5,308 | $52,866 | $18,293 | $34,573 |
| 2015 | -- | $49,930 | $17,277 | $32,653 |
| 2014 | -- | $47,510 | $12,957 | $34,553 |
| 2013 | -- | $48,381 | $13,195 | $35,186 |
Source: Public Records
Map
Nearby Homes
- 327 Gregory m Sears Dr Unit 8
- 125 Augusta Dr Unit 8
- 137 Augusta Dr
- 445 Evergreen Cir Unit 6033
- 449 Evergreen Cir Unit 6035
- 260 Breckenridge Dr
- 281 Boulder Ct Unit 6
- 154 Timber Trails Blvd Unit 6482
- 885 Tipperary St
- 533 Telluride Dr Unit 6346
- 0 Tyrrell Rd
- 447 Jean St
- 378 Pierce St
- 13N441 Coombs Rd
- 196 Shining Moon Path
- 3500 Hopewell Place
- 12N901 Coombs Rd
- 747 Jamestowne Ct
- 3612 Waterscape Terrace
- 215 Tollview Ct
- 280 Aspen Cir
- 288 Aspen Cir Unit 1
- 98 Woodland Park Cir
- 276 Aspen Cir
- 102 Woodland Park Cir Unit 1
- 80 Woodland Park Cir Unit 1
- 252 Aspen Cir Unit 1
- 272 Aspen Cir Unit 1
- 279 Aspen Cir Unit 1
- 106 Woodland Park Cir
- 248 Aspen Cir Unit 1
- 89 Woodland Park Cir Unit 1
- 93 Woodland Park Cir
- 85 Woodland Park Cir Unit 1
- 275 Aspen Cir
- 97 Woodland Park Cir Unit 1
- 74 Woodland Park Cir
- 244 Aspen Cir Unit 1
- 110 Woodland Park Cir Unit 1
- 81 Woodland Park Cir