Estimated Value: $78,000 - $105,906
2
Beds
1
Bath
768
Sq Ft
$123/Sq Ft
Est. Value
About This Home
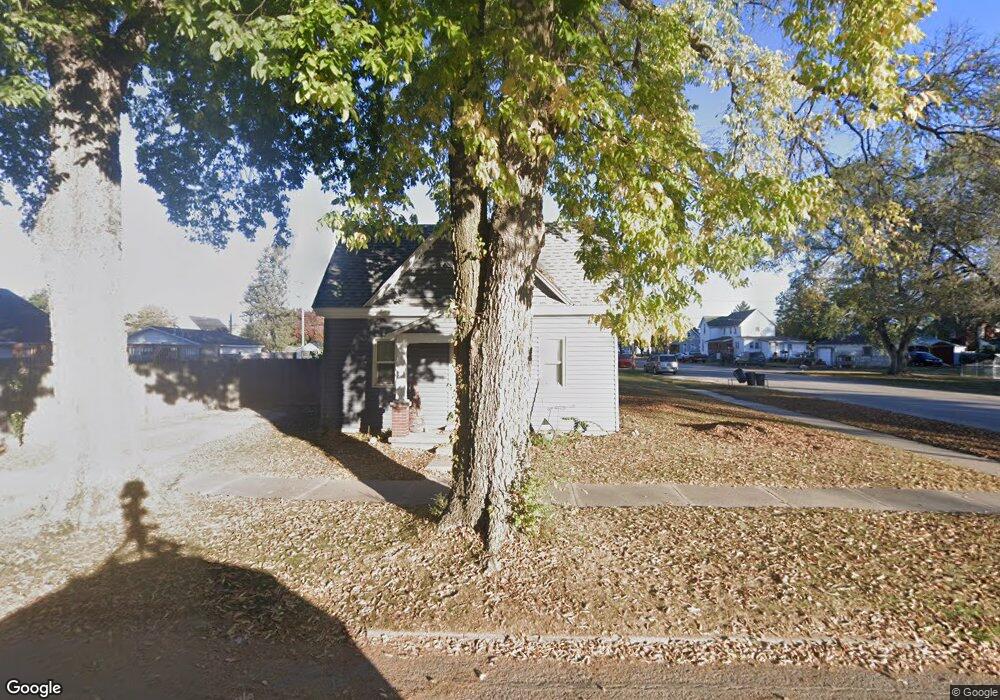
This home is located at 284 E 2nd St, Peru, IN 46970 and is currently estimated at $94,477, approximately $123 per square foot. 284 E 2nd St is a home located in Miami County with nearby schools including Elmwood Primary Learning Center, Blair Pointe Upper Elementary School, and Peru Junior/High School.
Ownership History
Date
Name
Owned For
Owner Type
Purchase Details
Closed on
Aug 3, 2017
Sold by
Raber Sherry L and Raber Debra A
Bought by
Raber Sherry
Current Estimated Value
Purchase Details
Closed on
Aug 25, 2016
Sold by
Raber Sherry L
Bought by
Raber Sherryl and Raber Debra A
Purchase Details
Closed on
Jan 6, 2009
Sold by
Latta Charles K
Bought by
Raber Sherry L
Create a Home Valuation Report for This Property
The Home Valuation Report is an in-depth analysis detailing your home's value as well as a comparison with similar homes in the area
Home Values in the Area
Average Home Value in this Area
Purchase History
| Date | Buyer | Sale Price | Title Company |
|---|---|---|---|
| Raber Sherry | -- | None Available | |
| Raber Sherryl | -- | None Available | |
| Raber Sherry L | -- | None Available |
Source: Public Records
Tax History
| Year | Tax Paid | Tax Assessment Tax Assessment Total Assessment is a certain percentage of the fair market value that is determined by local assessors to be the total taxable value of land and additions on the property. | Land | Improvement |
|---|---|---|---|---|
| 2025 | $432 | $54,300 | $7,100 | $47,200 |
| 2024 | $432 | $42,100 | $7,100 | $35,000 |
| 2023 | $421 | $39,300 | $7,100 | $32,200 |
| 2022 | $237 | $39,300 | $7,100 | $32,200 |
| 2021 | $224 | $36,700 | $7,100 | $29,600 |
| 2020 | $209 | $36,700 | $7,100 | $29,600 |
| 2019 | $220 | $36,700 | $7,100 | $29,600 |
| 2018 | $156 | $31,300 | $7,100 | $24,200 |
| 2017 | $127 | $28,700 | $4,600 | $24,100 |
| 2016 | $127 | $28,700 | $4,600 | $24,100 |
| 2014 | $56 | $21,100 | $4,600 | $16,500 |
| 2013 | -- | $21,000 | $4,600 | $16,400 |
Source: Public Records
Map
Nearby Homes
Your Personal Tour Guide
Ask me questions while you tour the home.