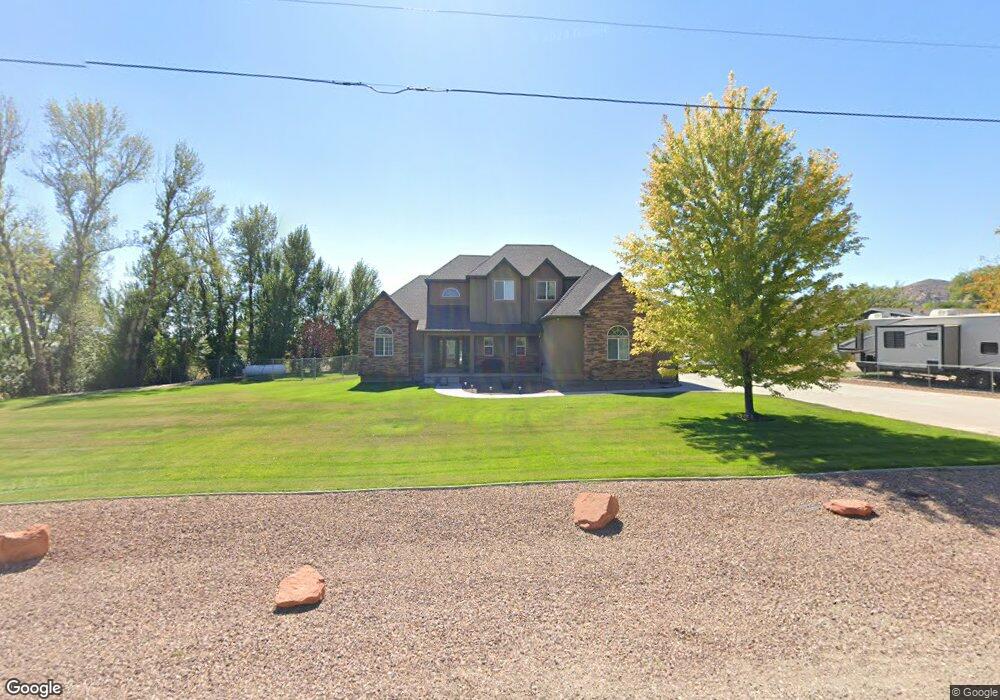
284 E 4500 S Vernal, UT 84078
Estimated Value: $446,000 - $727,398
4
Beds
3
Baths
2,562
Sq Ft
$231/Sq Ft
Est. Value
About This Home
This home is located at 284 E 4500 S, Vernal, UT 84078 and is currently estimated at $592,850, approximately $231 per square foot. 284 E 4500 S is a home located in Uintah County with nearby schools including Davis School, Vernal Middle School, and Uintah Middle School.
Ownership History
Date
Name
Owned For
Owner Type
Purchase Details
Closed on
Jul 5, 2016
Sold by
Dixon Roy and Dixon Mary Lou
Bought by
Dixon Roy G and Dixon Mary Lou
Current Estimated Value
Purchase Details
Closed on
Nov 30, 2009
Sold by
Runolfson Eric L
Bought by
Runolfson Eric L and Runolfson Kristina
Home Financials for this Owner
Home Financials are based on the most recent Mortgage that was taken out on this home.
Original Mortgage
$136,900
Interest Rate
5.01%
Mortgage Type
New Conventional
Purchase Details
Closed on
Nov 9, 2006
Sold by
Wagner Stanley John and Wagner Sarah Joann
Bought by
Runolfson Eric L and Runolfson Kristina
Home Financials for this Owner
Home Financials are based on the most recent Mortgage that was taken out on this home.
Original Mortgage
$544,000
Interest Rate
6.36%
Mortgage Type
Purchase Money Mortgage
Create a Home Valuation Report for This Property
The Home Valuation Report is an in-depth analysis detailing your home's value as well as a comparison with similar homes in the area
Purchase History
| Date | Buyer | Sale Price | Title Company |
|---|---|---|---|
| Dixon Roy G | -- | None Available | |
| Dixon Roy | -- | None Available | |
| Runolfson Eric L | -- | -- | |
| Runolfson Eric L | -- | -- | |
| Runolfson Eric L | -- | -- |
Source: Public Records
Mortgage History
| Date | Status | Borrower | Loan Amount |
|---|---|---|---|
| Previous Owner | Runolfson Eric L | $136,900 | |
| Previous Owner | Runolfson Eric L | $544,000 |
Source: Public Records
Tax History
| Year | Tax Paid | Tax Assessment Tax Assessment Total Assessment is a certain percentage of the fair market value that is determined by local assessors to be the total taxable value of land and additions on the property. | Land | Improvement |
|---|---|---|---|---|
| 2024 | $2,502 | $287,473 | $33,477 | $253,996 |
| 2023 | $2,416 | $270,856 | $33,477 | $237,379 |
| 2022 | $2,305 | $223,380 | $33,477 | $189,903 |
| 2021 | $2,410 | $105,452 | $18,412 | $87,039 |
| 2020 | $2,274 | $185,793 | $27,720 | $158,073 |
| 2019 | $2,174 | $175,452 | $27,720 | $147,732 |
| 2018 | $2,084 | $168,417 | $27,720 | $140,697 |
| 2017 | $20 | $168,417 | $27,720 | $140,697 |
| 2016 | $1,947 | $172,768 | $27,720 | $145,048 |
| 2015 | $1,751 | $168,672 | $28,402 | $140,270 |
| 2014 | $1,478 | $144,036 | $28,402 | $115,634 |
| 2013 | $1,510 | $144,036 | $28,402 | $115,634 |
Source: Public Records
Map
Nearby Homes
Your Personal Tour Guide
Ask me questions while you tour the home.