Estimated Value: $1,111,000 - $1,316,031
3
Beds
3
Baths
2,418
Sq Ft
$508/Sq Ft
Est. Value
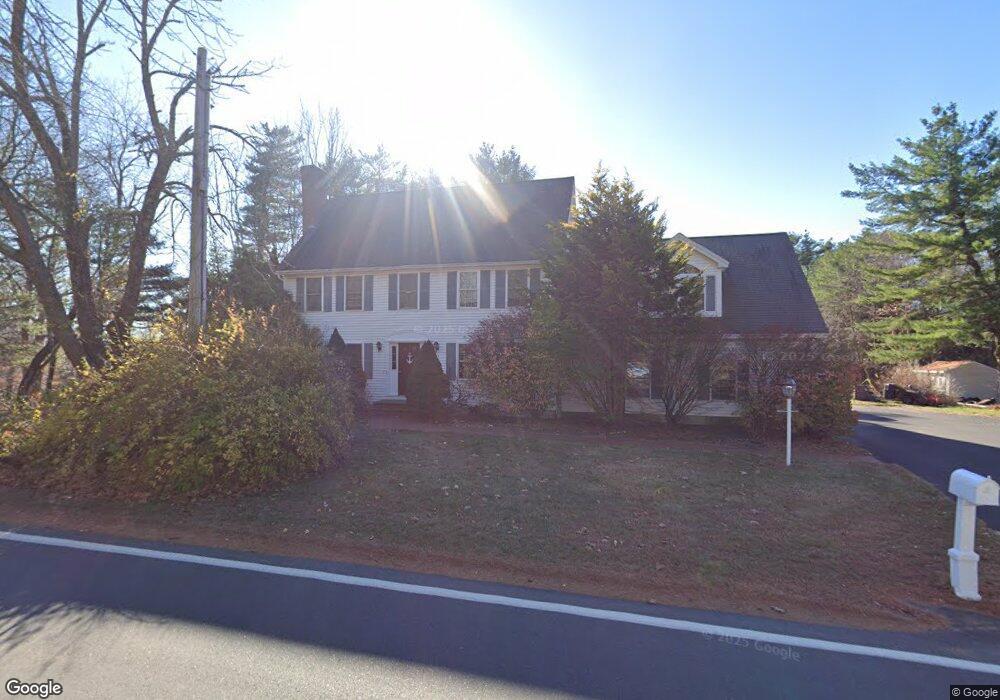
About This Home
This home is located at 284 Grove Rd, Rye, NH 03870 and is currently estimated at $1,227,508, approximately $507 per square foot. 284 Grove Rd is a home located in Rockingham County with nearby schools including Rye Elementary School, Rye Junior High School, and Rye Country Day School.
Ownership History
Date
Name
Owned For
Owner Type
Purchase Details
Closed on
Aug 10, 2015
Sold by
Dennehy Patrick T
Bought by
Dennehy Eva M
Current Estimated Value
Purchase Details
Closed on
Sep 24, 2009
Sold by
Margaret A Millar Ret and Millar
Bought by
Dennehy Patrick and Dennehy Eva M
Home Financials for this Owner
Home Financials are based on the most recent Mortgage that was taken out on this home.
Original Mortgage
$370,000
Interest Rate
5.31%
Mortgage Type
Purchase Money Mortgage
Purchase Details
Closed on
Aug 27, 1999
Sold by
Connelly Martha E
Bought by
Millar Margaret Ann
Create a Home Valuation Report for This Property
The Home Valuation Report is an in-depth analysis detailing your home's value as well as a comparison with similar homes in the area
Home Values in the Area
Average Home Value in this Area
Purchase History
We collect this data history from publicly available records. To have your information removed, we recommend requesting removal directly through your county’s website.
| Date | Buyer | Sale Price | Title Company |
|---|---|---|---|
| Dennehy Eva M | -- | -- | |
| Dennehy Patrick | $462,500 | -- | |
| Millar Margaret Ann | $299,900 | -- |
Source: Public Records
Mortgage History
We collect this data history from publicly available records. To have your information removed, we recommend requesting removal directly through your county’s website.
| Date | Status | Borrower | Loan Amount |
|---|---|---|---|
| Previous Owner | Millar Margaret Ann | $277,000 | |
| Previous Owner | Millar Margaret Ann | $364,500 | |
| Previous Owner | Millar Margaret Ann | $370,000 |
Source: Public Records
Tax History
| Year | Tax Paid | Tax Assessment Tax Assessment Total Assessment is a certain percentage of the fair market value that is determined by local assessors to be the total taxable value of land and additions on the property. | Land | Improvement |
|---|---|---|---|---|
| 2025 | $6,858 | $819,400 | $452,500 | $366,900 |
| 2024 | $7,096 | $819,400 | $452,500 | $366,900 |
| 2023 | $6,580 | $819,400 | $452,500 | $366,900 |
| 2022 | $5,636 | $807,400 | $452,500 | $354,900 |
| 2021 | $5,329 | $521,400 | $307,800 | $213,600 |
| 2020 | $5,610 | $521,400 | $307,800 | $213,600 |
| 2019 | $5,329 | $521,400 | $307,800 | $213,600 |
| 2018 | $5,757 | $521,400 | $307,800 | $213,600 |
| 2017 | $5,536 | $521,400 | $307,800 | $213,600 |
| 2016 | $4,750 | $444,800 | $224,000 | $220,800 |
| 2013 | $4,883 | $445,100 | $224,000 | $221,100 |
Source: Public Records
Map
Nearby Homes
Your Personal Tour Guide
Ask me questions while you tour the home.