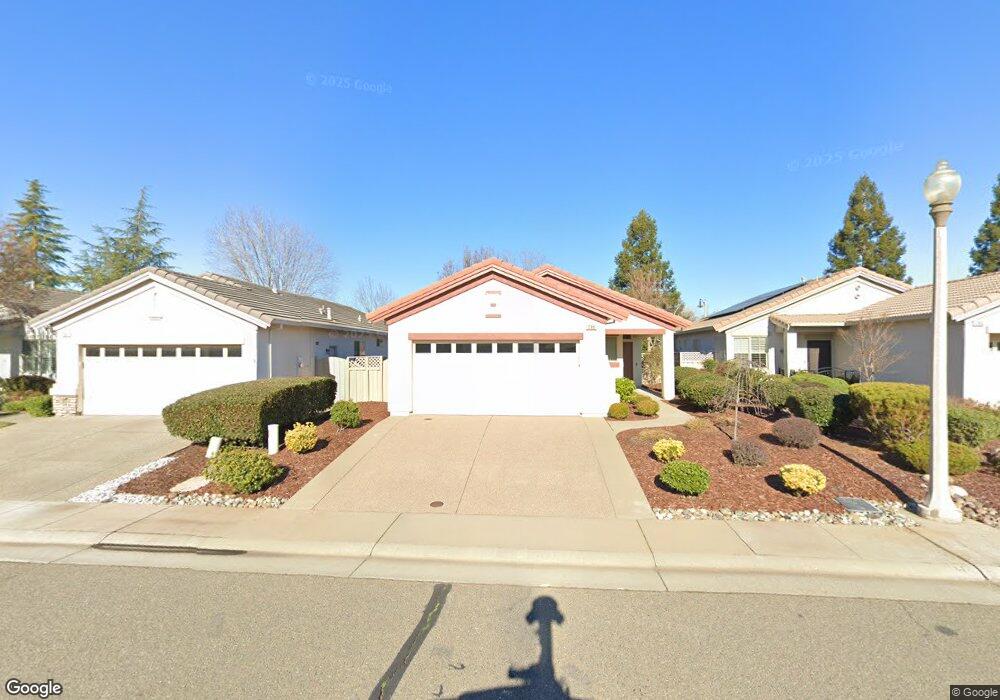
284 Lariat Loop Lincoln, CA 95648
Sun City Lincoln Hills NeighborhoodEstimated Value: $443,928 - $526,000
2
Beds
2
Baths
1,130
Sq Ft
$436/Sq Ft
Est. Value
About This Home
This home is located at 284 Lariat Loop, Lincoln, CA 95648 and is currently estimated at $492,982, approximately $436 per square foot. 284 Lariat Loop is a home located in Placer County with nearby schools including Twelve Bridges Elementary School, Twelve Bridges Middle School, and Lincoln Christian Academy.
Ownership History
Date
Name
Owned For
Owner Type
Purchase Details
Closed on
Feb 5, 2016
Sold by
Betley Nancy Ann
Bought by
Betley Nancy Ann
Current Estimated Value
Purchase Details
Closed on
Feb 22, 2011
Sold by
Bank Of America National Association
Bought by
Betley Nancy Ann
Home Financials for this Owner
Home Financials are based on the most recent Mortgage that was taken out on this home.
Original Mortgage
$131,000
Outstanding Balance
$89,598
Interest Rate
4.77%
Mortgage Type
New Conventional
Estimated Equity
$403,384
Purchase Details
Closed on
Oct 15, 2010
Sold by
Leonard Donald R
Bought by
Bank Of America National Association
Purchase Details
Closed on
Dec 12, 2002
Sold by
Del Webb California Corp
Bought by
Taylor Michael S and Taylor Nancy L
Home Financials for this Owner
Home Financials are based on the most recent Mortgage that was taken out on this home.
Original Mortgage
$151,500
Interest Rate
5.12%
Mortgage Type
Purchase Money Mortgage
Create a Home Valuation Report for This Property
The Home Valuation Report is an in-depth analysis detailing your home's value as well as a comparison with similar homes in the area
Home Values in the Area
Average Home Value in this Area
Purchase History
| Date | Buyer | Sale Price | Title Company |
|---|---|---|---|
| Betley Nancy Ann | -- | None Available | |
| Betley Nancy Ann | $185,000 | Servicelink | |
| Bank Of America National Association | $187,129 | Servicelink | |
| Taylor Michael S | $189,500 | First American Title |
Source: Public Records
Mortgage History
| Date | Status | Borrower | Loan Amount |
|---|---|---|---|
| Open | Betley Nancy Ann | $131,000 | |
| Previous Owner | Taylor Michael S | $151,500 | |
| Closed | Taylor Michael S | $28,446 |
Source: Public Records
Tax History
| Year | Tax Paid | Tax Assessment Tax Assessment Total Assessment is a certain percentage of the fair market value that is determined by local assessors to be the total taxable value of land and additions on the property. | Land | Improvement |
|---|---|---|---|---|
| 2025 | $2,445 | $237,007 | $160,142 | $76,865 |
| 2023 | $2,445 | $227,805 | $153,924 | $73,881 |
| 2022 | $2,698 | $223,339 | $150,906 | $72,433 |
| 2021 | $2,651 | $218,961 | $147,948 | $71,013 |
| 2020 | $2,638 | $216,716 | $146,431 | $70,285 |
| 2019 | $2,579 | $212,467 | $143,560 | $68,907 |
| 2018 | $2,523 | $208,302 | $140,746 | $67,556 |
| 2017 | $2,453 | $204,219 | $137,987 | $66,232 |
| 2016 | $2,401 | $200,216 | $135,282 | $64,934 |
| 2015 | $2,356 | $197,209 | $133,250 | $63,959 |
| 2014 | $2,303 | $193,347 | $130,640 | $62,707 |
Source: Public Records
Map
Nearby Homes
- 265 Lariat Loop
- 290 Lariat Loop
- 435 Stockman Ln
- 584 Rustic Ranch Ln
- 113 Lasso Lake Ct
- 101 Lasso Lake Ct
- 380 Lilypond Ln
- 28 Crystalwood Cir
- 1128 Southbridge Cir
- 1071 Hollingsworth Dr
- 608 Wagon Wheel Ln
- 1141 Southwick Ln
- 114 Marland Ct
- 102 Marland Ct
- 1136 Kensington Ln
- 504 Sawmill Ct
- 209 Calistoga Ln
- 902 2nd St
- 1295 Hawthorne Ln
- 1274 Hawthorne Ln
- 282 Lariat Loop
- 280 Lariat Loop
- 283 Lariat Loop
- 285 Lariat Loop
- 278 Lariat Loop
- 281 Lariat Loop
- 279 Lariat Loop
- 276 Lariat Loop
- 292 Lariat Loop
- 205 Lariat Place
- 294 Lariat Loop
- 277 Lariat Loop
- 274 Lariat Loop
- 215 Lariat Place
- 296 Lariat Loop
- 298 Lariat Loop
- 267 Lariat Loop
- 272 Lariat Loop
- 225 Lariat Loop
- 300 Lariat Loop
Your Personal Tour Guide
Ask me questions while you tour the home.