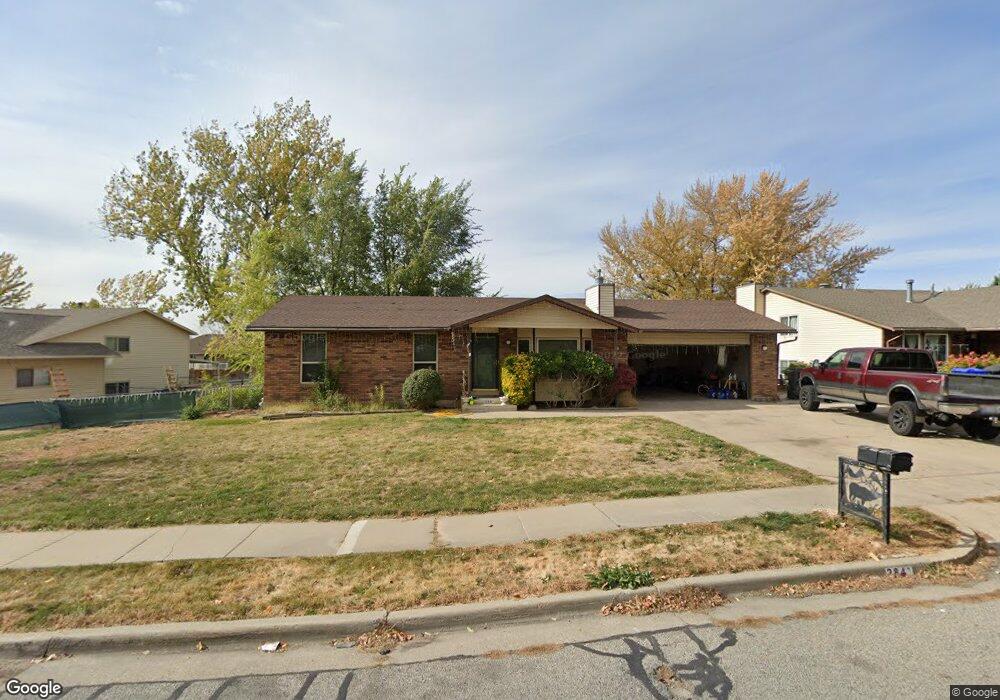
284 N 1600 W Clearfield, UT 84015
Estimated Value: $459,000 - $516,000
5
Beds
2
Baths
2,146
Sq Ft
$226/Sq Ft
Est. Value
About This Home
This home is located at 284 N 1600 W, Clearfield, UT 84015 and is currently estimated at $484,550, approximately $225 per square foot. 284 N 1600 W is a home located in Davis County with nearby schools including Lakeside School, West Point Junior High School, and Syracuse High School.
Ownership History
Date
Name
Owned For
Owner Type
Purchase Details
Closed on
Aug 16, 2013
Sold by
Lamar Antoine
Bought by
Lamar Antoine D and Lamar Cassie D
Current Estimated Value
Home Financials for this Owner
Home Financials are based on the most recent Mortgage that was taken out on this home.
Original Mortgage
$196,377
Outstanding Balance
$146,291
Interest Rate
4.51%
Mortgage Type
FHA
Estimated Equity
$338,259
Purchase Details
Closed on
May 5, 2006
Sold by
The Family Trust Of Richard H & Charlott and Burgin Richard H
Bought by
Boatright Justin and Boatright Amy
Home Financials for this Owner
Home Financials are based on the most recent Mortgage that was taken out on this home.
Original Mortgage
$166,400
Interest Rate
6.3%
Mortgage Type
Fannie Mae Freddie Mac
Purchase Details
Closed on
Feb 12, 1999
Sold by
Burgin Richard H and Burgin Charlotte F
Bought by
Burgin Richard H and Burgin Charlotte F
Create a Home Valuation Report for This Property
The Home Valuation Report is an in-depth analysis detailing your home's value as well as a comparison with similar homes in the area
Home Values in the Area
Average Home Value in this Area
Purchase History
| Date | Buyer | Sale Price | Title Company |
|---|---|---|---|
| Lamar Antoine D | -- | Mountain View Title & E | |
| Lamar Antoine | -- | None Available | |
| Boatright Justin | -- | Backman Title Services | |
| Burgin Richard H | -- | -- |
Source: Public Records
Mortgage History
| Date | Status | Borrower | Loan Amount |
|---|---|---|---|
| Open | Lamar Antoine | $196,377 | |
| Previous Owner | Boatright Justin | $166,400 |
Source: Public Records
Tax History Compared to Growth
Tax History
| Year | Tax Paid | Tax Assessment Tax Assessment Total Assessment is a certain percentage of the fair market value that is determined by local assessors to be the total taxable value of land and additions on the property. | Land | Improvement |
|---|---|---|---|---|
| 2025 | $2,852 | $267,300 | $114,639 | $152,661 |
| 2024 | $2,682 | $252,450 | $103,199 | $149,251 |
| 2023 | $2,483 | $430,000 | $129,166 | $300,834 |
| 2022 | $2,675 | $253,550 | $67,336 | $186,214 |
| 2021 | $2,412 | $342,000 | $104,637 | $237,363 |
| 2020 | $2,123 | $297,000 | $88,008 | $208,992 |
| 2019 | $2,058 | $284,000 | $85,354 | $198,646 |
| 2018 | $1,853 | $252,000 | $85,127 | $166,873 |
| 2016 | $1,595 | $114,125 | $32,948 | $81,177 |
| 2015 | $1,570 | $106,480 | $32,948 | $73,532 |
| 2014 | $1,541 | $105,920 | $32,948 | $72,972 |
| 2013 | -- | $71,135 | $27,798 | $43,337 |
Source: Public Records
Map
Nearby Homes
- 1774 W 400 N
- 575 N 1350 W Unit 137
- 47 N 1750 W
- 1652 W 560 N
- 1350 W 300 N Unit 49
- 1350 W 300 N Unit 38
- 1350 W 300 N Unit 29
- 563 N 1350 W Unit 139
- 1337 W 550 N Unit 195
- 16 N 1300 W
- 135 S 1525 W
- 1648 W 150 S
- 423 N 1250 W Unit 118
- 1828 W 75 S
- 1805 W 675 N
- 12 N 2000 W Unit 1
- 303 N Canterbury Way
- 417 N 1200 W Unit 84
- 607 N 2000 W
- 1832 W 725 N