A
Seller's Agent in 2017
Antonio Alberto
Alberto Real Estate
(774) 955-8915
4 in this area
27 Total Sales
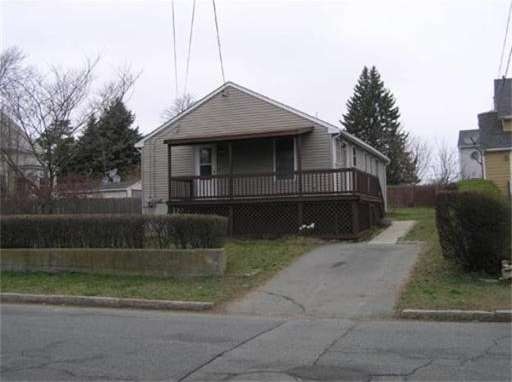
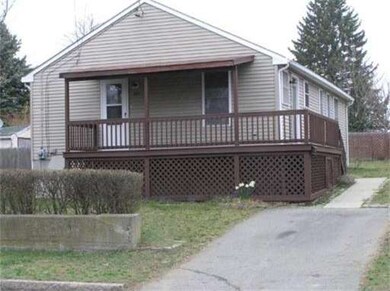
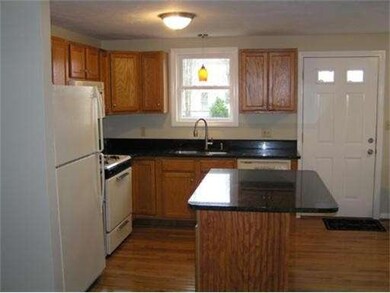
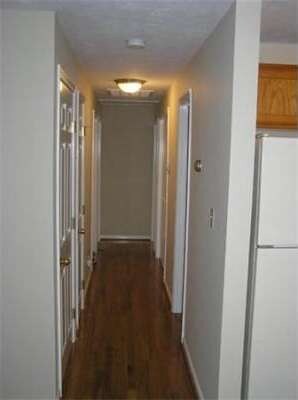
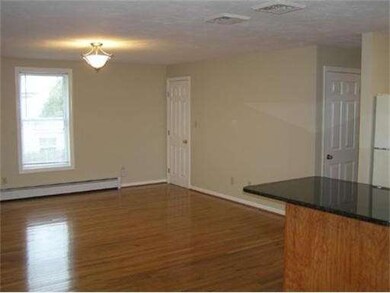
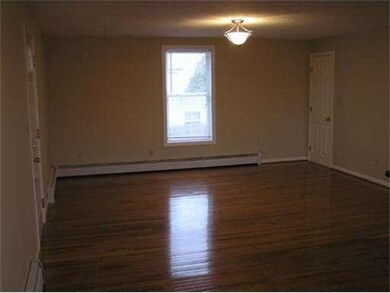
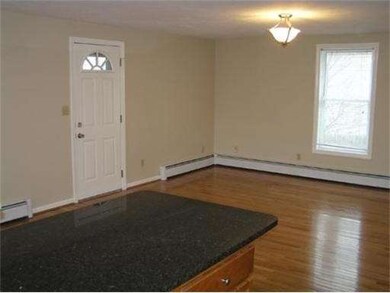
Beautiful nearly new 3 bedroom ranch with hardwood floors in living, dining, and kitchen. Full bath in master, tile floors in baths. Gorgeous granite countertops, fully applianced. Unfinished few step walkout basement with high ceilings, great for expansion. Great, convenient location in Maplewood area.
Home Type
Single Family
Est. Annual Taxes
$4,904
Year Built
1999
Lot Details
0
| Date | Type | Sale Price | Title Company |
|---|---|---|---|
| Fiduciary Deed | $95,000 | -- | |
| Deed | -- | -- |
| Date | Event | Price | Change | Sq Ft Price |
|---|---|---|---|---|
| 09/22/2017 09/22/17 | Sold | $220,000 | -4.3% | $210 / Sq Ft |
| 07/15/2017 07/15/17 | Pending | -- | -- | -- |
| 06/10/2017 06/10/17 | For Sale | $229,900 | +4.5% | $219 / Sq Ft |
| 06/07/2017 06/07/17 | Off Market | $220,000 | -- | -- |
| 12/07/2016 12/07/16 | For Sale | $229,900 | +35.2% | $219 / Sq Ft |
| 05/14/2012 05/14/12 | Sold | $170,000 | -6.5% | $156 / Sq Ft |
| 05/10/2012 05/10/12 | Pending | -- | -- | -- |
| 04/12/2012 04/12/12 | Price Changed | $181,900 | -2.7% | $167 / Sq Ft |
| 04/06/2012 04/06/12 | For Sale | $186,900 | -- | $171 / Sq Ft |
| Year | Tax Paid | Tax Assessment Tax Assessment Total Assessment is a certain percentage of the fair market value that is determined by local assessors to be the total taxable value of land and additions on the property. | Land | Improvement |
|---|---|---|---|---|
| 2025 | $4,904 | $428,300 | $125,400 | $302,900 |
| 2024 | $4,574 | $398,100 | $120,600 | $277,500 |
| 2023 | $4,426 | $360,700 | $103,400 | $257,300 |
| 2022 | $3,809 | $301,800 | $94,000 | $207,800 |
| 2021 | $3,585 | $259,200 | $87,000 | $172,200 |
| 2020 | $3,429 | $237,300 | $83,200 | $154,100 |
| 2019 | $3,250 | $222,900 | $79,300 | $143,600 |
| 2018 | $2,569 | $175,700 | $77,800 | $97,900 |
| 2017 | $2,457 | $175,500 | $79,400 | $96,100 |
| 2016 | $2,366 | $173,600 | $82,700 | $90,900 |
| 2015 | $2,262 | $172,900 | $79,600 | $93,300 |
| 2014 | $2,228 | $177,100 | $83,800 | $93,300 |
A
Seller's Agent in 2017
Antonio Alberto
Alberto Real Estate
(774) 955-8915
4 in this area
27 Total Sales
L
Buyer's Agent in 2017
Linda Mathieu
Lamacchia Realty, Inc.

Seller's Agent in 2012
Jason Saphire
Saphire Hospitality, Inc.
(877) 249-5478
1,183 Total Sales
Source: MLS Property Information Network (MLS PIN)
MLS Number: 71363079
APN: FALL-000005E-000000-000049
Disclaimer: Certain information contained herein is derived from information provided by parties other than Homes.com. All information provided is deemed reliable, but is not guaranteed to be accurate and should be independently verified.
![]() The property listing data and information, or the Images, set forth herein were provided to MLS Property Information Network, Inc. from third party sources, including sellers, lessors and public records, and were compiled by MLS Property Information Network, Inc. The property listing data and information, and the Images, are for the personal, non-commercial use of consumers having a good faith interest in purchasing or leasing listed properties of the type displayed to them and may not be used for any purpose other than to identify prospective properties which such consumers may have a good faith interest in purchasing or leasing. MLS Property Information Network, Inc. and its subscribers disclaim any and all representations and warranties as to the accuracy of the property listing data and information, or as to the accuracy of any of the Images, set forth herein.
The property listing data and information, or the Images, set forth herein were provided to MLS Property Information Network, Inc. from third party sources, including sellers, lessors and public records, and were compiled by MLS Property Information Network, Inc. The property listing data and information, and the Images, are for the personal, non-commercial use of consumers having a good faith interest in purchasing or leasing listed properties of the type displayed to them and may not be used for any purpose other than to identify prospective properties which such consumers may have a good faith interest in purchasing or leasing. MLS Property Information Network, Inc. and its subscribers disclaim any and all representations and warranties as to the accuracy of the property listing data and information, or as to the accuracy of any of the Images, set forth herein.