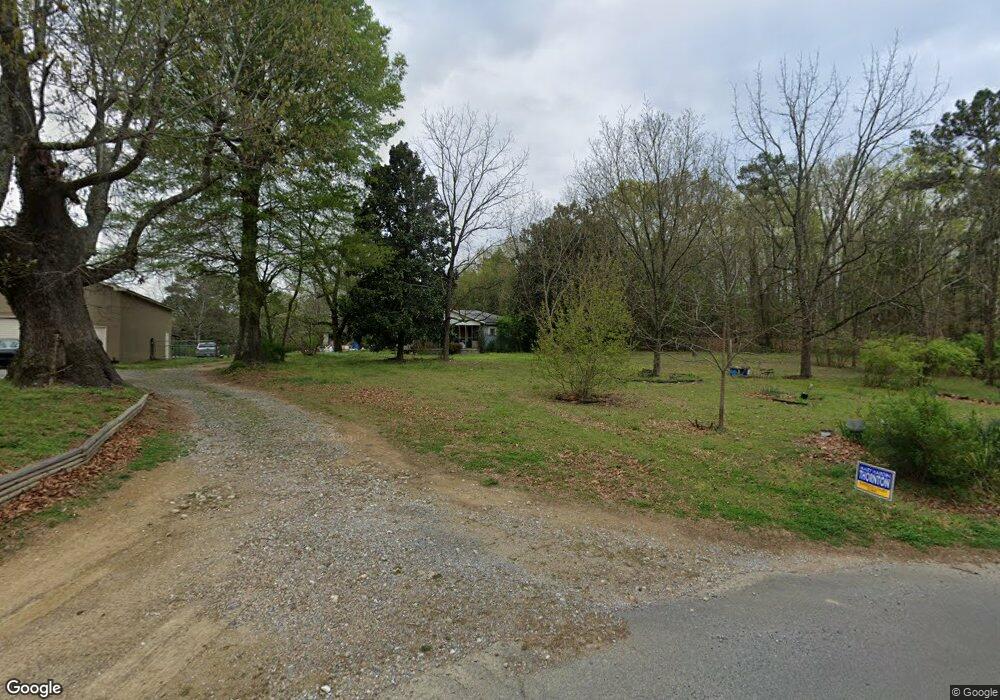
284 Randall Rd SW Cave Spring, GA 30124
Estimated Value: $148,600 - $240,000
7
Beds
1
Bath
1,488
Sq Ft
$136/Sq Ft
Est. Value
About This Home
This home is located at 284 Randall Rd SW, Cave Spring, GA 30124 and is currently estimated at $202,200, approximately $135 per square foot. 284 Randall Rd SW is a home with nearby schools including Pepperell Middle School and Pepperell High School.
Ownership History
Date
Name
Owned For
Owner Type
Purchase Details
Closed on
Apr 1, 2019
Sold by
Jones Michael H
Bought by
Johnson Melissa and Norton Kristen
Current Estimated Value
Purchase Details
Closed on
Nov 26, 2018
Sold by
Norton Kristen Corbin
Bought by
Norton Matthew Douglas
Home Financials for this Owner
Home Financials are based on the most recent Mortgage that was taken out on this home.
Original Mortgage
$174,074
Interest Rate
4.8%
Mortgage Type
New Conventional
Purchase Details
Closed on
Aug 31, 2017
Sold by
Corbin Carol A
Bought by
Johnston Melissa and Norton Krisen Corbin
Purchase Details
Closed on
Feb 4, 2008
Sold by
Treglown Jones Margaret
Bought by
Morgan Melissa L and Corbin Kristen L
Purchase Details
Closed on
Jan 2, 1960
Sold by
P\R
Bought by
P\R
Purchase Details
Closed on
Jan 1, 1960
Sold by
Jones Henry H
Bought by
P\R
Purchase Details
Closed on
Jan 1, 1959
Bought by
Jones Henry H
Create a Home Valuation Report for This Property
The Home Valuation Report is an in-depth analysis detailing your home's value as well as a comparison with similar homes in the area
Home Values in the Area
Average Home Value in this Area
Purchase History
| Date | Buyer | Sale Price | Title Company |
|---|---|---|---|
| Johnson Melissa | -- | -- | |
| Norton Kristen | -- | -- | |
| Norton Matthew Douglas | -- | -- | |
| Johnston Melissa | -- | -- | |
| Morgan Melissa L | -- | -- | |
| Jones Margaret Treglown | -- | -- | |
| P\R | -- | -- | |
| P\R | -- | -- | |
| Jones Henry H | -- | -- |
Source: Public Records
Mortgage History
| Date | Status | Borrower | Loan Amount |
|---|---|---|---|
| Previous Owner | Norton Matthew Douglas | $174,074 |
Source: Public Records
Tax History Compared to Growth
Tax History
| Year | Tax Paid | Tax Assessment Tax Assessment Total Assessment is a certain percentage of the fair market value that is determined by local assessors to be the total taxable value of land and additions on the property. | Land | Improvement |
|---|---|---|---|---|
| 2024 | $1,206 | $37,902 | $24,055 | $13,847 |
| 2023 | $1,084 | $37,782 | $21,868 | $15,914 |
| 2022 | $925 | $31,181 | $18,091 | $13,090 |
| 2021 | $794 | $26,291 | $16,370 | $9,921 |
| 2020 | $717 | $23,568 | $14,234 | $9,334 |
| 2019 | $690 | $22,960 | $14,234 | $8,726 |
| 2018 | $726 | $53,161 | $43,953 | $9,208 |
| 2017 | $704 | $52,811 | $43,953 | $8,858 |
| 2016 | $439 | $52,478 | $43,920 | $8,558 |
| 2015 | $398 | $52,478 | $43,920 | $8,558 |
| 2014 | $398 | $52,478 | $43,920 | $8,558 |
Source: Public Records
Map
Nearby Homes
- 0 Booger Hollow Rd
- 5854 Cedartown Hwy SW
- 5866 Hwy 27 S
- 0 Booger Hollow Rd SW Unit 17969096
- 849 Booger Hollow Rd SW
- 1250 Adams Rd
- 5165 Cave Spring Rd SW
- 0 Collins Rd Unit 10627302
- 938 Marion Dairy Rd
- 90 W Meadow Lakes Blvd
- 113 Cherokee Estates Dr
- 88 Sequoyah Ct
- 110 Mulberry Ln
- 2129 Lake Creek Rd
- 600 Miller Rd
- 31 Meadow Lakes Terrace
- TRACT3 Drummond Rd
- Tract2 Drummond Rd
- 4365 Cave Spring Rd SW
- 0 Oakmont Dr SW Unit 10648261
- 156 Randall Rd SW
- 279 Randall Rd SW
- 288 Randall Rd SW
- 313 Randall Rd SW
- 300 Randall Rd SW
- 302 Randall Rd SW
- 325 Randall Rd SW
- 336 Randall Rd SW
- 371 Randall Rd SW
- 85 Randall Rd SW
- 391 Randall Rd SW
- 393 Randall Rd SW
- 422 Randall Rd SW
- 423 Randall Rd SW
- 1893 Booger Hollow Rd SW
- 449 Randall Rd SW
- 1728 Booger Hollow Rd SW
- 463 Randall Rd SW
- 551 Lyons Bridge Rd SW
- 575 Lyons Bridge Rd SW