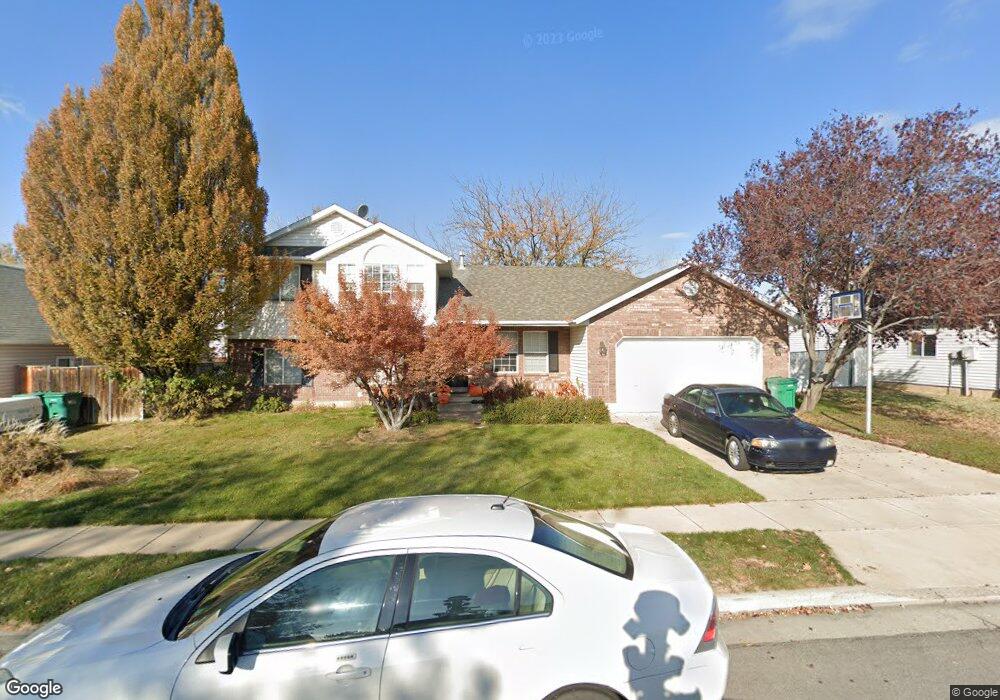
2840 Brady Way Layton, UT 84041
Estimated Value: $484,000 - $531,000
5
Beds
3
Baths
1,292
Sq Ft
$393/Sq Ft
Est. Value
About This Home
This home is located at 2840 Brady Way, Layton, UT 84041 and is currently estimated at $507,620, approximately $392 per square foot. 2840 Brady Way is a home located in Davis County with nearby schools including Legacy Junior High School, Layton High School, and North Davis Preparatory Academy.
Ownership History
Date
Name
Owned For
Owner Type
Purchase Details
Closed on
Feb 4, 2009
Sold by
Bennetsen Steven J
Bought by
Bennetsen Steven J and Bennetsen Kathryn
Current Estimated Value
Home Financials for this Owner
Home Financials are based on the most recent Mortgage that was taken out on this home.
Original Mortgage
$106,500
Interest Rate
4.83%
Mortgage Type
New Conventional
Purchase Details
Closed on
Aug 25, 2006
Sold by
Goff Nathan S and Goff Lesly H
Bought by
Bennetsen Steven and Bennetsen Kathryn
Home Financials for this Owner
Home Financials are based on the most recent Mortgage that was taken out on this home.
Original Mortgage
$105,000
Interest Rate
6.56%
Mortgage Type
Purchase Money Mortgage
Purchase Details
Closed on
Feb 25, 1999
Sold by
Smith Michael Erick and Smith Shalees
Bought by
Goff Nathan S and Goff Lesly H
Home Financials for this Owner
Home Financials are based on the most recent Mortgage that was taken out on this home.
Original Mortgage
$149,600
Interest Rate
6.78%
Create a Home Valuation Report for This Property
The Home Valuation Report is an in-depth analysis detailing your home's value as well as a comparison with similar homes in the area
Home Values in the Area
Average Home Value in this Area
Purchase History
| Date | Buyer | Sale Price | Title Company |
|---|---|---|---|
| Bennetsen Steven J | -- | Mountain View Title | |
| Bennetsen Steven J | -- | Mountain View Title | |
| Bennetsen Steven | -- | Bonneville Superior Title Co | |
| Goff Nathan S | -- | Bonneville Title Company Inc |
Source: Public Records
Mortgage History
| Date | Status | Borrower | Loan Amount |
|---|---|---|---|
| Closed | Bennetsen Steven J | $106,500 | |
| Closed | Bennetsen Steven | $105,000 | |
| Previous Owner | Goff Nathan S | $149,600 |
Source: Public Records
Tax History Compared to Growth
Tax History
| Year | Tax Paid | Tax Assessment Tax Assessment Total Assessment is a certain percentage of the fair market value that is determined by local assessors to be the total taxable value of land and additions on the property. | Land | Improvement |
|---|---|---|---|---|
| 2025 | $2,510 | $263,450 | $107,311 | $156,139 |
| 2024 | $2,377 | $251,349 | $119,442 | $131,907 |
| 2023 | $2,259 | $231,550 | $64,195 | $167,354 |
| 2022 | $2,456 | $452,000 | $134,520 | $317,480 |
| 2021 | $2,233 | $337,000 | $111,011 | $225,989 |
| 2020 | $2,016 | $292,000 | $93,095 | $198,905 |
| 2019 | $1,953 | $277,000 | $96,424 | $180,576 |
| 2018 | $1,777 | $253,000 | $84,469 | $168,531 |
| 2016 | $1,671 | $122,760 | $32,727 | $90,033 |
| 2015 | $1,586 | $110,605 | $32,727 | $77,878 |
| 2014 | $1,547 | $110,310 | $32,727 | $77,583 |
| 2013 | -- | $101,539 | $28,952 | $72,587 |
Source: Public Records
Map
Nearby Homes