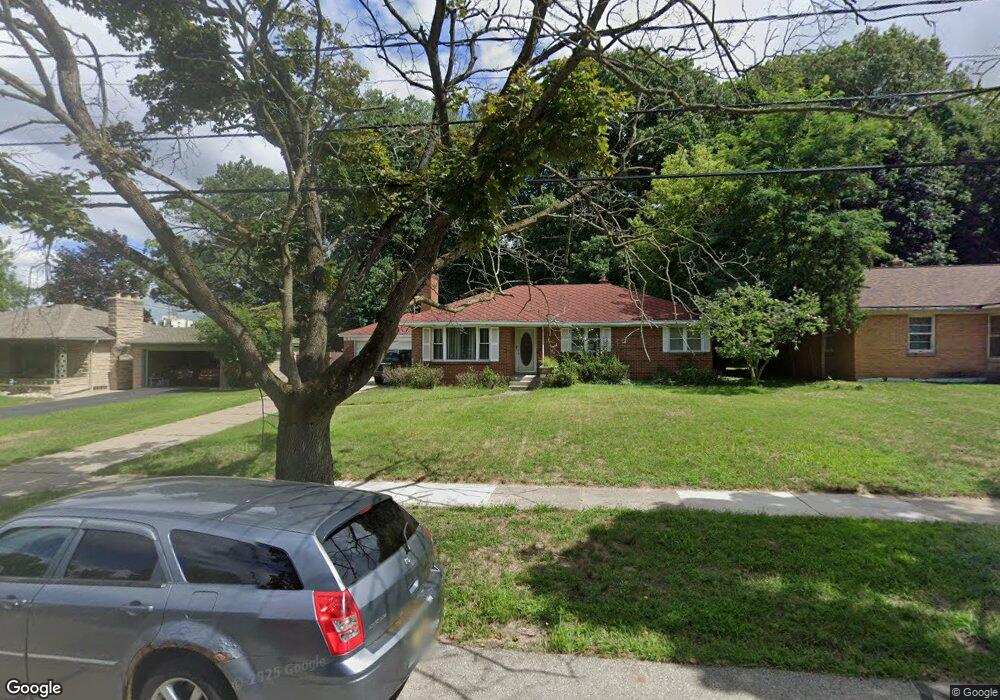
2840 Chamberlain Ave SE Grand Rapids, MI 49508
Millbrook NeighborhoodEstimated Value: $259,000 - $308,000
3
Beds
1
Bath
1,848
Sq Ft
$156/Sq Ft
Est. Value
About This Home
This home is located at 2840 Chamberlain Ave SE, Grand Rapids, MI 49508 and is currently estimated at $287,936, approximately $155 per square foot. 2840 Chamberlain Ave SE is a home located in Kent County with nearby schools including Sherwood Park Global Studies Academy, Alger Middle School, and Ottawa Hills High School.
Ownership History
Date
Name
Owned For
Owner Type
Purchase Details
Closed on
Jun 28, 2019
Sold by
Mayfield Timothy L and Mayfield Yvette F
Bought by
Mayfield Timothy L and Ferguson Yvette
Current Estimated Value
Purchase Details
Closed on
Aug 28, 2013
Sold by
Cobbins Janice L
Bought by
Mayfield Timothy L and Mayfield Yvette F
Purchase Details
Closed on
Jan 26, 2005
Sold by
Mayfield Timothy and Mayfield Yvette
Bought by
Mayfield Timothy and Mayfield Yvette
Home Financials for this Owner
Home Financials are based on the most recent Mortgage that was taken out on this home.
Original Mortgage
$126,063
Interest Rate
5.78%
Mortgage Type
FHA
Purchase Details
Closed on
Mar 16, 1998
Sold by
Butz Butz S S and Butz Guikema J
Bought by
Mayfield Guikema J and Mayfield Timothy L
Purchase Details
Closed on
Mar 13, 1996
Sold by
Schmidt Schmidt J J and Schmidt Butz S
Bought by
Mayfield Butz S and Mayfield Timothy L
Purchase Details
Closed on
Nov 9, 1993
Purchase Details
Closed on
Jul 31, 1989
Create a Home Valuation Report for This Property
The Home Valuation Report is an in-depth analysis detailing your home's value as well as a comparison with similar homes in the area
Home Values in the Area
Average Home Value in this Area
Purchase History
| Date | Buyer | Sale Price | Title Company |
|---|---|---|---|
| Mayfield Timothy L | -- | None Available | |
| Mayfield Timothy L | -- | None Available | |
| Mayfield Timothy | -- | -- | |
| Mayfield Guikema J | $107,000 | -- | |
| Mayfield Butz S | $98,500 | -- | |
| -- | -- | -- | |
| -- | $70,000 | -- |
Source: Public Records
Mortgage History
| Date | Status | Borrower | Loan Amount |
|---|---|---|---|
| Previous Owner | Mayfield Timothy | $126,063 |
Source: Public Records
Tax History Compared to Growth
Tax History
| Year | Tax Paid | Tax Assessment Tax Assessment Total Assessment is a certain percentage of the fair market value that is determined by local assessors to be the total taxable value of land and additions on the property. | Land | Improvement |
|---|---|---|---|---|
| 2025 | $1,997 | $125,000 | $0 | $0 |
| 2024 | $1,997 | $114,700 | $0 | $0 |
| 2023 | $2,026 | $93,200 | $0 | $0 |
| 2022 | $1,923 | $83,300 | $0 | $0 |
| 2021 | $1,881 | $81,700 | $0 | $0 |
| 2020 | $1,798 | $75,600 | $0 | $0 |
| 2019 | $1,883 | $69,300 | $0 | $0 |
| 2018 | $1,818 | $68,700 | $0 | $0 |
| 2017 | $1,770 | $60,100 | $0 | $0 |
| 2016 | $1,792 | $51,900 | $0 | $0 |
| 2015 | $1,666 | $51,900 | $0 | $0 |
| 2013 | -- | $49,000 | $0 | $0 |
Source: Public Records
Map
Nearby Homes
- 2905 Woodside Ave SE
- 2958 Woodside Ave SE
- 3031 Chamberlain Ct SE
- 3024 Juneberry Ave SE
- 2700 Birchcrest Dr SE Unit 9
- 3041 Juneberry Ave SE
- 1659 Shangrai La Dr SE
- 2530 Village Dr SE Unit 117
- 2526 Birchcrest Dr SE
- 1878 Georgetown Dr SE Unit 40
- 1955 Millbank St SE
- 1954 Georgetown Dr SE Unit 21
- 1951 Millbrook St SE
- 2236 Tecumseh Dr SE
- 2303 Sylvan Ave SE
- 1827 Millbrook St SE
- 3536 Whispering Brook Dr SE Unit 63
- 2610 32nd St SE
- 2559 Alger St SE
- 3508 Whispering Brook Dr SE Unit 5
- 2848 Chamberlain Ave SE
- 2832 Chamberlain Ave SE
- 2856 Chamberlain Ave SE
- 2006 28th St SE
- 2845 Chamberlain Ave SE
- 2833 Chamberlain Ave SE
- 2857 Englewood Ave SE Unit 2867
- 2864 Chamberlain Ave SE
- 2819 Chamberlain Ave SE
- 2855 Chamberlain Ave SE
- 2887 Englewood Ave SE
- 2863 Chamberlain Ave SE
- 2904 Chamberlain Ave SE
- 2845 Englewood Ave SE
- 2845 Englewood Ave SE Unit 2897
- 2845 Englewood Ave SE Unit 2853
- 2903 Chamberlain Ave SE
- 2871 Englewood Ave SE
- 2912 Chamberlain Ave SE
- 2902 Woodside Ave SE