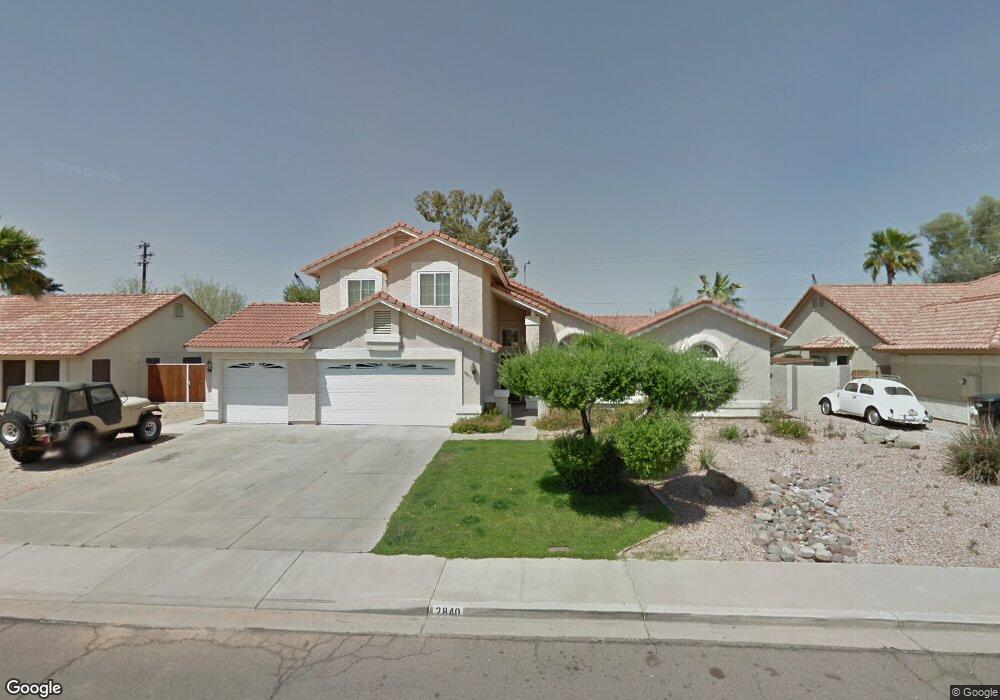
2840 E Nora St Mesa, AZ 85213
Rancho de Arboleda NeighborhoodEstimated Value: $555,999 - $648,000
--
Bed
4
Baths
2,450
Sq Ft
$249/Sq Ft
Est. Value
About This Home
This home is located at 2840 E Nora St, Mesa, AZ 85213 and is currently estimated at $610,750, approximately $249 per square foot. 2840 E Nora St is a home located in Maricopa County with nearby schools including Ishikawa Elementary School, Franklin at Brimhall Elementary School, and Franklin West Elementary School.
Ownership History
Date
Name
Owned For
Owner Type
Purchase Details
Closed on
Aug 7, 2014
Sold by
Bittner Jonathan C and Bittner Judy B
Bought by
Jonathan C Bittner & Judy B Bitner Trust
Current Estimated Value
Purchase Details
Closed on
Jan 3, 1996
Sold by
Weinstein Martin S
Bought by
Bittner Jonathan C and Bittner Judy B
Home Financials for this Owner
Home Financials are based on the most recent Mortgage that was taken out on this home.
Original Mortgage
$117,800
Interest Rate
7.04%
Mortgage Type
New Conventional
Create a Home Valuation Report for This Property
The Home Valuation Report is an in-depth analysis detailing your home's value as well as a comparison with similar homes in the area
Home Values in the Area
Average Home Value in this Area
Purchase History
| Date | Buyer | Sale Price | Title Company |
|---|---|---|---|
| Jonathan C Bittner & Judy B Bitner Trust | -- | None Available | |
| Bittner Jonathan C | $124,000 | Stewart Title & Trust |
Source: Public Records
Mortgage History
| Date | Status | Borrower | Loan Amount |
|---|---|---|---|
| Previous Owner | Bittner Jonathan C | $117,800 |
Source: Public Records
Tax History Compared to Growth
Tax History
| Year | Tax Paid | Tax Assessment Tax Assessment Total Assessment is a certain percentage of the fair market value that is determined by local assessors to be the total taxable value of land and additions on the property. | Land | Improvement |
|---|---|---|---|---|
| 2025 | $2,497 | $29,557 | -- | -- |
| 2024 | $2,523 | $28,149 | -- | -- |
| 2023 | $2,523 | $42,810 | $8,560 | $34,250 |
| 2022 | $2,469 | $33,660 | $6,730 | $26,930 |
| 2021 | $2,528 | $32,480 | $6,490 | $25,990 |
| 2020 | $2,494 | $29,450 | $5,890 | $23,560 |
| 2019 | $2,313 | $27,270 | $5,450 | $21,820 |
| 2018 | $2,207 | $25,360 | $5,070 | $20,290 |
| 2017 | $2,138 | $25,460 | $5,090 | $20,370 |
| 2016 | $2,099 | $24,400 | $4,880 | $19,520 |
| 2015 | $1,979 | $22,720 | $4,540 | $18,180 |
Source: Public Records
Map
Nearby Homes
- 2753 E Northridge Cir
- 2863 E Norwood St
- 2854 E Mallory St
- 2542 E Nora St
- 2625 N 24th St Unit 3
- 2625 N 24th St Unit 13
- 2625 N 24th St Unit 15
- 2928 E Palm St
- 2360 N Yale
- 2328 N Roca
- 2356 N Glenview
- 2830 E Presidio St
- 2538 E Preston St
- 2520 E Preston St
- 2915 E Russell St
- 2517 E Presidio St
- 2302 E Northridge St
- 2829 E Virginia St
- Residence Ten Plan at Grove at Lehi - Artisan
- Residence Twelve Plan at Grove at Lehi - Artisan
- 2846 E Nora St
- 2824 E Nora St
- 2841 E Nora St
- 2858 E Nora St
- 2816 E Nora St
- 2825 E Nora St
- 2849 E Nora St
- 2817 E Nora St
- 2859 E Nora St
- 2850 E Nance St
- 2808 E Nora St
- 2719 N Robin Ln
- 2907 E Nora St Unit 2
- 2710 N Roca
- 2862 E Nance St
- 2914 E Nora St
- 2736 N Robin Ln
- 2728 N Robin Ln
- 2915 E Nora St
- 2711 N Robin Ln