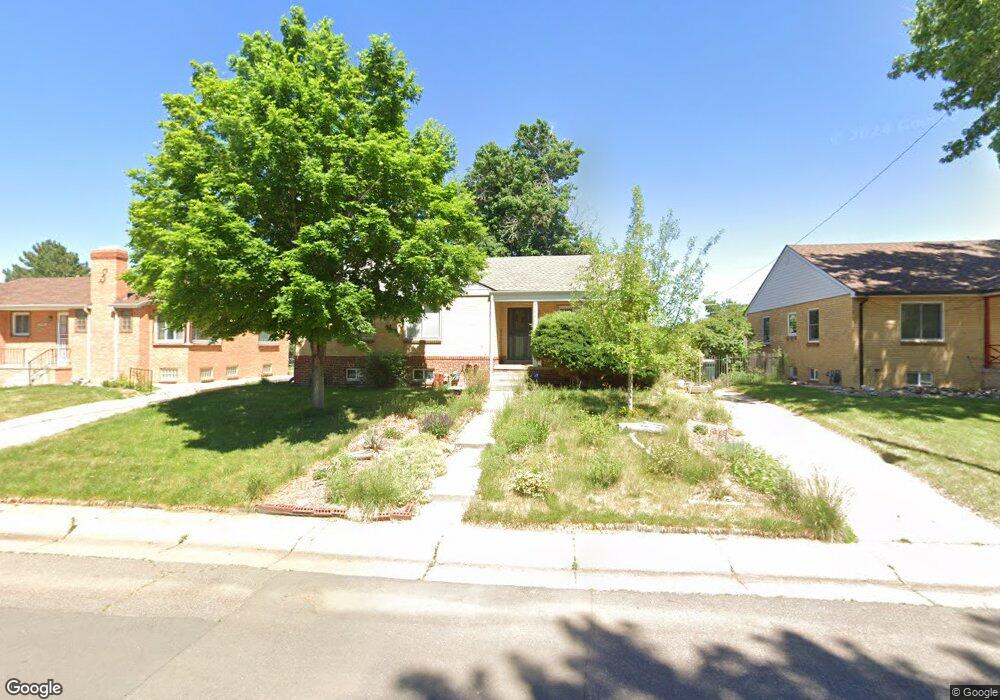
2840 Grape St Denver, CO 80207
North Park Hill NeighborhoodEstimated Value: $741,099 - $936,000
5
Beds
2
Baths
2,258
Sq Ft
$362/Sq Ft
Est. Value
About This Home
This home is located at 2840 Grape St, Denver, CO 80207 and is currently estimated at $817,775, approximately $362 per square foot. 2840 Grape St is a home located in Denver County with nearby schools including Park Hill Elementary, William (Bill) Roberts ECE-8 School, and McAuliffe International School.
Ownership History
Date
Name
Owned For
Owner Type
Purchase Details
Closed on
May 15, 2009
Sold by
Tierney Martha M and Kilburn Jonathan F
Bought by
Freehling Michael D
Current Estimated Value
Home Financials for this Owner
Home Financials are based on the most recent Mortgage that was taken out on this home.
Original Mortgage
$246,500
Outstanding Balance
$152,958
Interest Rate
4.84%
Mortgage Type
Purchase Money Mortgage
Estimated Equity
$664,817
Purchase Details
Closed on
Apr 24, 2000
Sold by
Jackson Tyrone
Bought by
Tierney Martha M and Kilburn Jonathan F
Home Financials for this Owner
Home Financials are based on the most recent Mortgage that was taken out on this home.
Original Mortgage
$179,900
Interest Rate
7.75%
Purchase Details
Closed on
Sep 10, 1999
Sold by
James Calvert Terry and James Cathy D
Bought by
Jackson Tyrone
Purchase Details
Closed on
May 26, 1999
Sold by
James Calvert Terry and James Cathy D
Bought by
North Park Hll Trust
Create a Home Valuation Report for This Property
The Home Valuation Report is an in-depth analysis detailing your home's value as well as a comparison with similar homes in the area
Home Values in the Area
Average Home Value in this Area
Purchase History
| Date | Buyer | Sale Price | Title Company |
|---|---|---|---|
| Freehling Michael D | $290,000 | None Available | |
| Tierney Martha M | $199,900 | -- | |
| Jackson Tyrone | -- | -- | |
| North Park Hll Trust | -- | -- | |
| North Park Hill Trust | -- | -- |
Source: Public Records
Mortgage History
| Date | Status | Borrower | Loan Amount |
|---|---|---|---|
| Open | Freehling Michael D | $246,500 | |
| Previous Owner | Tierney Martha M | $179,900 |
Source: Public Records
Tax History
| Year | Tax Paid | Tax Assessment Tax Assessment Total Assessment is a certain percentage of the fair market value that is determined by local assessors to be the total taxable value of land and additions on the property. | Land | Improvement |
|---|---|---|---|---|
| 2025 | $3,306 | $56,370 | $37,380 | $37,380 |
| 2024 | $3,306 | $48,440 | $31,840 | $16,600 |
| 2023 | $3,234 | $48,440 | $31,840 | $16,600 |
| 2022 | $2,570 | $39,270 | $26,320 | $12,950 |
| 2021 | $2,481 | $40,400 | $27,080 | $13,320 |
| 2020 | $2,258 | $37,580 | $27,080 | $10,500 |
| 2019 | $2,710 | $37,580 | $27,080 | $10,500 |
| 2018 | $2,415 | $31,220 | $17,730 | $13,490 |
| 2017 | $2,408 | $31,220 | $17,730 | $13,490 |
| 2016 | $2,250 | $27,590 | $10,849 | $16,741 |
| 2015 | $2,156 | $27,590 | $10,849 | $16,741 |
| 2014 | $2,006 | $24,150 | $5,126 | $19,024 |
Source: Public Records
Map
Nearby Homes
- 2865 Hudson St
- 2826 Hudson St
- 2870 Forest St
- 2870 Ivanhoe St
- 3011 Grape St
- 2935 Ivy St
- 2965 Ivy St
- 2921 Jasmine St
- 3607 Grape St
- 6003 E 28th Ave Unit 18
- 2390 N Glencoe St
- 2541 Elm St
- 2850 Kearney St
- 2860 Dahlia St
- 2680 Kearney St
- 2332 N Glencoe St
- 3099 Elm St
- 5210 E 33rd Ave
- 2289 N Glencoe St
- 2518 Kearney St
Your Personal Tour Guide
Ask me questions while you tour the home.