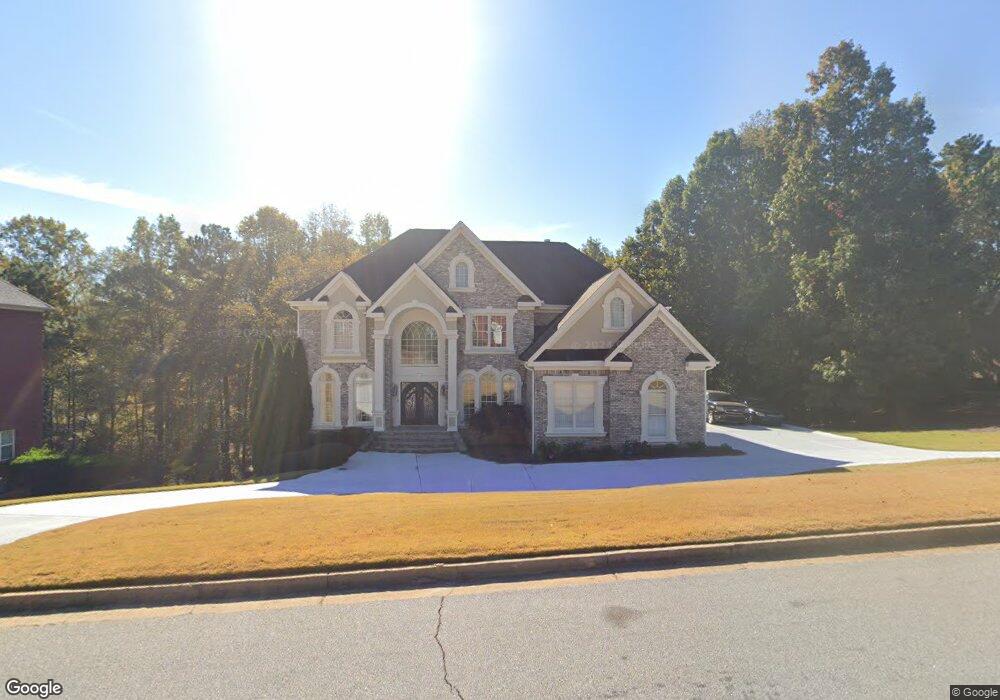
2840 Wellington Way SE Conyers, GA 30013
Estimated Value: $480,000 - $572,000
5
Beds
4
Baths
3,240
Sq Ft
$160/Sq Ft
Est. Value
About This Home
This home is located at 2840 Wellington Way SE, Conyers, GA 30013 and is currently estimated at $517,772, approximately $159 per square foot. 2840 Wellington Way SE is a home located in Rockdale County with nearby schools including Flat Shoals Elementary School, Memorial Middle School, and Salem High School.
Ownership History
Date
Name
Owned For
Owner Type
Purchase Details
Closed on
Apr 8, 2025
Sold by
Stone Latoya Danielle
Bought by
Collins Lenard Ray and Johnson Derrick William
Current Estimated Value
Purchase Details
Closed on
Oct 3, 2022
Sold by
Collins Wynde Jeanine
Bought by
Johnson Derrick William and Stone Latoya Danielle
Purchase Details
Closed on
Oct 28, 2005
Sold by
Collins Lenard and Collins Wyde
Bought by
Walker Arlene
Home Financials for this Owner
Home Financials are based on the most recent Mortgage that was taken out on this home.
Original Mortgage
$67,850
Interest Rate
5.34%
Mortgage Type
Unknown
Purchase Details
Closed on
Jun 15, 2004
Sold by
Collins Lenard
Bought by
Collins Lenard and Collins Wynde
Home Financials for this Owner
Home Financials are based on the most recent Mortgage that was taken out on this home.
Original Mortgage
$320,400
Interest Rate
6.09%
Mortgage Type
New Conventional
Create a Home Valuation Report for This Property
The Home Valuation Report is an in-depth analysis detailing your home's value as well as a comparison with similar homes in the area
Home Values in the Area
Average Home Value in this Area
Purchase History
| Date | Buyer | Sale Price | Title Company |
|---|---|---|---|
| Collins Lenard Ray | -- | -- | |
| Johnson Derrick William | -- | -- | |
| Walker Arlene | $450,000 | -- | |
| Collins Lenard | -- | -- | |
| Collins Lenard | $356,100 | -- |
Source: Public Records
Mortgage History
| Date | Status | Borrower | Loan Amount |
|---|---|---|---|
| Previous Owner | Walker Arlene | $67,850 | |
| Previous Owner | Walker Arlene | $359,650 | |
| Previous Owner | Collins Lenard | $320,400 |
Source: Public Records
Tax History Compared to Growth
Tax History
| Year | Tax Paid | Tax Assessment Tax Assessment Total Assessment is a certain percentage of the fair market value that is determined by local assessors to be the total taxable value of land and additions on the property. | Land | Improvement |
|---|---|---|---|---|
| 2024 | $6,348 | $247,400 | $52,120 | $195,280 |
| 2023 | $6,056 | $244,240 | $52,120 | $192,120 |
| 2022 | $4,569 | $186,320 | $29,000 | $157,320 |
| 2021 | $4,909 | $186,320 | $29,000 | $157,320 |
| 2020 | $4,642 | $167,800 | $25,560 | $142,240 |
| 2019 | $4,050 | $144,840 | $16,000 | $128,840 |
| 2018 | $4,076 | $144,840 | $16,000 | $128,840 |
| 2017 | $3,683 | $130,560 | $16,000 | $114,560 |
| 2016 | $3,403 | $130,560 | $16,000 | $114,560 |
| 2015 | $3,333 | $127,920 | $13,360 | $114,560 |
| 2014 | $2,976 | $127,920 | $13,360 | $114,560 |
| 2013 | -- | $182,680 | $28,000 | $154,680 |
Source: Public Records
Map
Nearby Homes
- 2791 Wellington Way SE Unit 1
- 2052 Evergreen Dr SE
- 1613 Brolington Ct
- 3095 Brombley Dr SE
- 1260 Sweet Shrub Ln SE
- 2561 Old Salem Cir SE
- 1388 Fall River Dr
- 3111 Green Gate Way SE
- 1115 Fountain Crest Dr
- 2585 Westchester Way SE
- 2754 Harvest Dr SE
- 2684 Harvest Dr SE
- 2638 Westchester Pkwy SE
- 3106 Brians Creek Dr SE
- 1180 Azalea Cir SE
- 3113 Brians Creek Dr SE
- 2513 Riverton Dr
- 3205 Haleys Way SE
- 2830 Wellington Way SE
- 2850 Wellington Way SE
- 2820 Wellington Way SE Unit 1
- 1139 Saint Remy Way SE
- 1139 St Remy Way
- 1143 Saint Remy Way SE Unit 2
- 1133 Saint Remy Way SE Unit 2
- 2841 Wellington Way SE
- 1133 St Remy Way
- 3120 Paddington Ct SE Unit 1
- 2901 Sutton Place SE
- 1125 Saint Remy Way SE
- 2851 Wellington Way SE
- 3130 Paddington Ct SE
- 2810 Wellington Way SE
- 0 Sutton Place SE Unit 3257592
- 0 Sutton Place SE Unit 8184206
- 0 Sutton Place SE
- 1147 Saint Remy Way SE
- 3140 Paddington Ct SE Unit 1