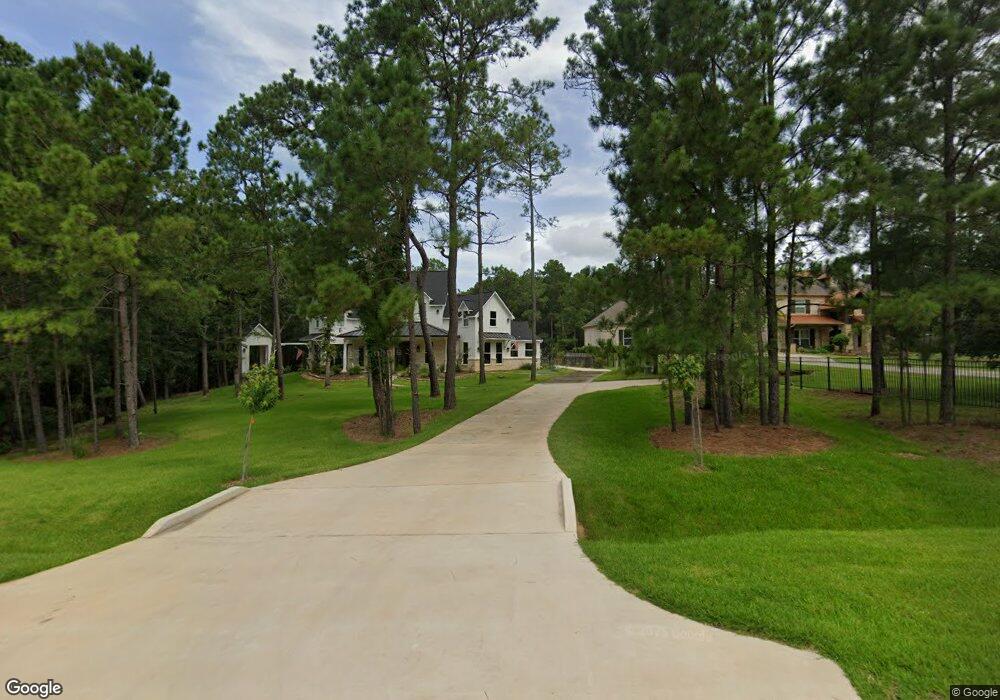
28403 Emerald Oaks Magnolia, TX 77355
Estimated Value: $251,000 - $485,000
--
Bed
--
Bath
--
Sq Ft
1.51
Acres
About This Home
This home is located at 28403 Emerald Oaks, Magnolia, TX 77355 and is currently estimated at $368,000. 28403 Emerald Oaks is a home located in Montgomery County with nearby schools including Magnolia Elementary School, Magnolia Sixth Grade Campus, and Magnolia Junior High School.
Ownership History
Date
Name
Owned For
Owner Type
Purchase Details
Closed on
Jan 28, 2021
Sold by
Scott Michael Raymond and Scott Roberta
Bought by
Fuqua Carlton and Fuqua Rachael
Current Estimated Value
Purchase Details
Closed on
Mar 7, 2014
Sold by
Sizemore Christopher R and Martin Marcus F
Bought by
Scott Michael Raymond and Scott Roberta
Home Financials for this Owner
Home Financials are based on the most recent Mortgage that was taken out on this home.
Original Mortgage
$64,600
Interest Rate
4.44%
Mortgage Type
New Conventional
Purchase Details
Closed on
Mar 16, 2007
Sold by
Field Melvin R and Field Stella R
Bought by
Sizemore Christopher R and Martin Marcus F
Home Financials for this Owner
Home Financials are based on the most recent Mortgage that was taken out on this home.
Original Mortgage
$146,250
Interest Rate
6.26%
Mortgage Type
Purchase Money Mortgage
Purchase Details
Closed on
Dec 16, 2002
Sold by
Jack Frey Properties Inc
Bought by
Scott Michael R and Scott Roberta
Create a Home Valuation Report for This Property
The Home Valuation Report is an in-depth analysis detailing your home's value as well as a comparison with similar homes in the area
Home Values in the Area
Average Home Value in this Area
Purchase History
| Date | Buyer | Sale Price | Title Company |
|---|---|---|---|
| Fuqua Carlton | -- | Allegiance Title | |
| Scott Michael Raymond | -- | None Available | |
| Sizemore Christopher R | -- | Alamo Title Company | |
| Scott Michael R | -- | -- |
Source: Public Records
Mortgage History
| Date | Status | Borrower | Loan Amount |
|---|---|---|---|
| Previous Owner | Scott Michael Raymond | $64,600 | |
| Previous Owner | Sizemore Christopher R | $146,250 |
Source: Public Records
Tax History Compared to Growth
Tax History
| Year | Tax Paid | Tax Assessment Tax Assessment Total Assessment is a certain percentage of the fair market value that is determined by local assessors to be the total taxable value of land and additions on the property. | Land | Improvement |
|---|---|---|---|---|
| 2025 | $4,199 | $265,265 | $265,265 | -- |
| 2024 | $3,552 | $265,265 | $265,265 | -- |
| 2023 | $3,552 | $265,270 | $265,270 | $0 |
| 2022 | $3,168 | $179,550 | $179,550 | $0 |
| 2021 | $2,465 | $125,000 | $125,000 | $0 |
| 2020 | $3,528 | $174,320 | $174,320 | $0 |
| 2019 | $3,511 | $174,320 | $174,320 | $0 |
| 2018 | $2,243 | $106,110 | $106,110 | $0 |
| 2017 | $2,250 | $106,110 | $106,110 | $0 |
| 2016 | $2,250 | $106,110 | $106,110 | $0 |
| 2015 | $2,276 | $106,110 | $106,110 | $0 |
| 2014 | $2,276 | $106,110 | $106,110 | $0 |
Source: Public Records
Map
Nearby Homes
- 28322 Meadow Forest
- 37432 Clubhouse Ln
- 28242 Forest Green Dr
- TBD Fm 1774 Rd
- 18742 Mink Lake Dr
- 28733 Lakeside Green
- Resolution 3K Plan at Waterford Run - Clayton
- Colossal Plan at Waterford Run - Clayton
- The Jackson Plan at Waterford Run - Jessup
- Crazy Eights Plan at Waterford Run - Clayton
- 18631 Mink Lake Dr
- 24569 Fm 1488
- 28523 Beth Marie
- 28543 Beth Marie
- 28046 Crossway Oaks
- 28028 Crossway Oaks
- 16715 Frosted Evergreen Ct
- 28208 Nichols Sawmill Rd
- 29010 Legacy Ct
- 28103 Hitching Rack Ln
- 28413 Emerald Oaks
- 28323 Emerald Oaks
- 28423 Emerald Oaks
- 28342 Emerald Oaks
- 28332 Emerald Oaks
- 28433 Emerald Oaks
- 28422 Emerald Oaks
- 37622 Meadowwood Green
- 37602 Meadow Wood
- 28322 Emerald Oaks
- 28275 Emerald Oaks
- 28412 Meadow Forest
- 28443 Emerald Oaks
- 28312 Emerald Oaks
- 28422 Meadow Forest
- 28402 Meadow Forest
- 28432 Meadow Forest
- 28293 Eagle Cove
- 28442 Emerald Oaks
- 37603 Meadowwood Green