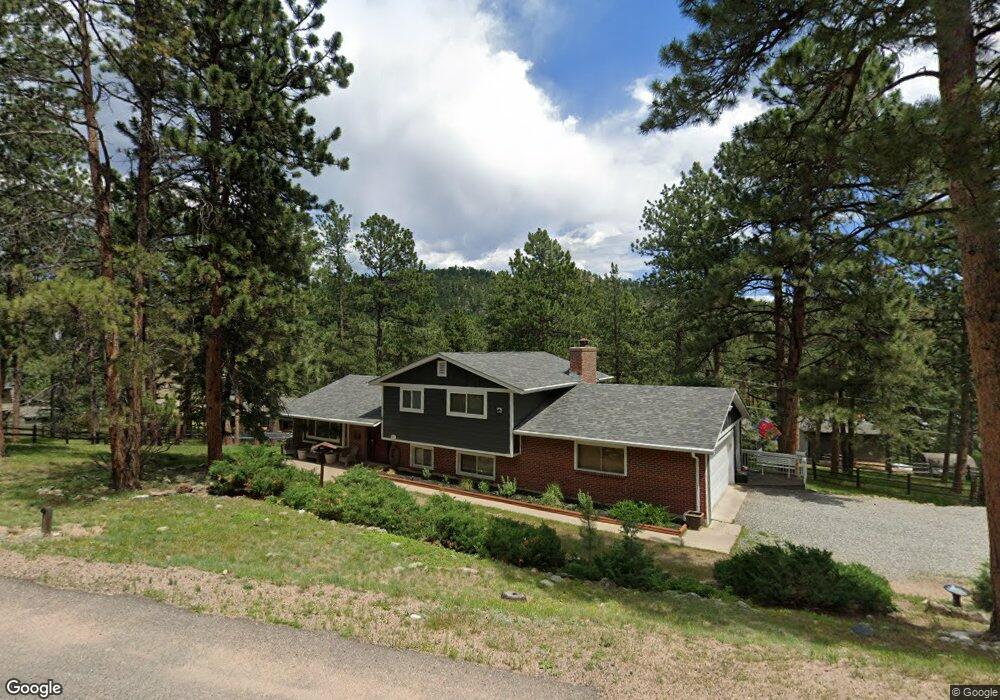
28409 Pine Dr Evergreen, CO 80439
Hiwan Hills NeighborhoodEstimated Value: $708,724 - $887,000
4
Beds
5
Baths
1,295
Sq Ft
$625/Sq Ft
Est. Value
About This Home
This home is located at 28409 Pine Dr, Evergreen, CO 80439 and is currently estimated at $808,931, approximately $624 per square foot. 28409 Pine Dr is a home located in Jefferson County with nearby schools including Bergen Meadow Primary School, Bergen Valley Intermediate School, and Evergreen Middle School.
Ownership History
Date
Name
Owned For
Owner Type
Purchase Details
Closed on
Apr 30, 2015
Sold by
Macek Theresa S
Bought by
Cowden Laura A
Current Estimated Value
Home Financials for this Owner
Home Financials are based on the most recent Mortgage that was taken out on this home.
Original Mortgage
$385,881
Outstanding Balance
$304,830
Interest Rate
4.4%
Mortgage Type
FHA
Estimated Equity
$504,101
Purchase Details
Closed on
Apr 15, 2015
Sold by
Macek William L
Bought by
Macek Theresa S
Home Financials for this Owner
Home Financials are based on the most recent Mortgage that was taken out on this home.
Original Mortgage
$385,881
Outstanding Balance
$304,830
Interest Rate
4.4%
Mortgage Type
FHA
Estimated Equity
$504,101
Purchase Details
Closed on
Sep 30, 1996
Sold by
Burt Richard F and Burt Mary E
Bought by
Macek William L and Macek Theresa S
Purchase Details
Closed on
Oct 29, 1993
Sold by
Tischner Audrone C
Bought by
Burt Richard F and Burt Mary E
Create a Home Valuation Report for This Property
The Home Valuation Report is an in-depth analysis detailing your home's value as well as a comparison with similar homes in the area
Home Values in the Area
Average Home Value in this Area
Purchase History
| Date | Buyer | Sale Price | Title Company |
|---|---|---|---|
| Cowden Laura A | $393,000 | Land Title Guarantee Company | |
| Macek Theresa S | -- | Land Title Guarantee Company | |
| Macek William L | $168,000 | -- | |
| Burt Richard F | $156,000 | -- |
Source: Public Records
Mortgage History
| Date | Status | Borrower | Loan Amount |
|---|---|---|---|
| Open | Cowden Laura A | $385,881 |
Source: Public Records
Tax History
| Year | Tax Paid | Tax Assessment Tax Assessment Total Assessment is a certain percentage of the fair market value that is determined by local assessors to be the total taxable value of land and additions on the property. | Land | Improvement |
|---|---|---|---|---|
| 2024 | $3,637 | $39,662 | $9,829 | $29,833 |
| 2023 | $3,637 | $39,662 | $9,829 | $29,833 |
| 2022 | $3,488 | $36,916 | $11,890 | $25,026 |
| 2021 | $3,524 | $37,978 | $12,232 | $25,746 |
| 2020 | $3,663 | $39,175 | $15,355 | $23,820 |
| 2019 | $3,612 | $39,175 | $15,355 | $23,820 |
| 2018 | $2,841 | $29,810 | $7,651 | $22,159 |
| 2017 | $2,587 | $29,810 | $7,651 | $22,159 |
| 2016 | $2,293 | $24,690 | $9,932 | $14,758 |
| 2015 | $2,341 | $24,690 | $9,932 | $14,758 |
| 2014 | $2,341 | $24,457 | $10,901 | $13,556 |
Source: Public Records
Map
Nearby Homes
- 28609 Pine Dr
- 28449 Douglas Park Rd
- 4148 Timbervale Dr
- 27972 Meadow Dr Unit 220
- 27972 Meadow Dr Unit 320
- 27972 Meadow Dr Unit 210
- 27972 Meadow Dr Unit 310
- 27972 Meadow Dr Unit 120
- 27901 Pine Dr
- 28964 Western Dr
- 27906 Lupine Dr
- 4125 Aspen Ln
- 4812 S Cedar Rd
- 4865 Silver Spruce Ln
- 4912 Silver Spruce Ln
- 4266 Troutdale Village Dr
- 29859 Park Village Dr
- 0000 S Indian Trail
- 4660 Independence Trail
- 0 S Pine Rd
- 28410 Pine Dr
- 28359 Pine Dr
- 28509 Pine Dr
- 28360 Pine Dr
- 28413 Pipe Bearer Ln
- 28345 Meadow Dr
- 28510 Pine Dr
- 28504 Meadow Dr
- 28373 Pipe Bearer Ln
- 28309 Pine Dr
- 28310 Pine Dr
- 28414 Pipe Bearer Ln
- 28559 Pine Dr
- 28304 Meadow Dr
- 28374 Pipe Bearer Ln
- 28560 Pine Dr
- 28554 Meadow Dr
- 28333 Pipe Bearer Ln
- 28259 Pine Dr
- 4437 Ohtama Dr
Your Personal Tour Guide
Ask me questions while you tour the home.