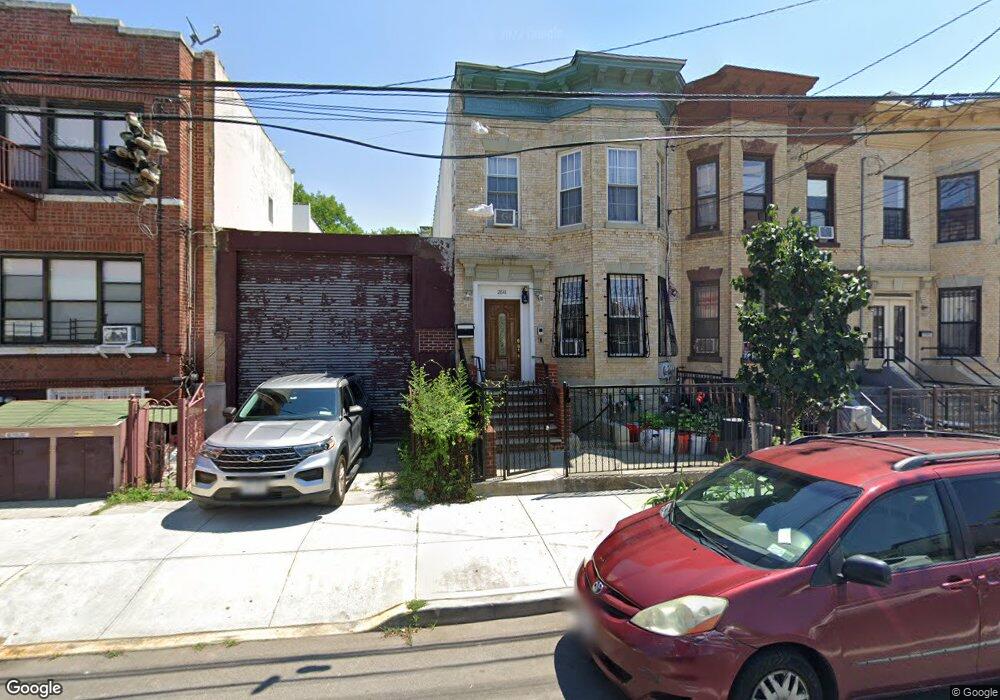
2841 W 20th St Unit Building Brooklyn, NY 11224
Coney Island NeighborhoodEstimated Value: $837,181 - $1,176,000
--
Bed
3
Baths
2,706
Sq Ft
$357/Sq Ft
Est. Value
About This Home
This home is located at 2841 W 20th St Unit Building, Brooklyn, NY 11224 and is currently estimated at $964,795, approximately $356 per square foot. 2841 W 20th St Unit Building is a home located in Kings County with nearby schools including P.S. 288 The Shirley Tanyhill and Is 228 David A Boody.
Ownership History
Date
Name
Owned For
Owner Type
Purchase Details
Closed on
Apr 18, 2024
Sold by
Abdullah Mahdi N
Bought by
Muharram Llc
Current Estimated Value
Home Financials for this Owner
Home Financials are based on the most recent Mortgage that was taken out on this home.
Original Mortgage
$250,000
Outstanding Balance
$246,265
Interest Rate
6.88%
Mortgage Type
Purchase Money Mortgage
Estimated Equity
$718,530
Purchase Details
Closed on
May 7, 2021
Sold by
Williams Sakina
Bought by
Abdullah Mahdi N
Home Financials for this Owner
Home Financials are based on the most recent Mortgage that was taken out on this home.
Original Mortgage
$742,775
Interest Rate
3%
Mortgage Type
Purchase Money Mortgage
Purchase Details
Closed on
Feb 14, 2006
Sold by
Robert Williams Sr As Beneficiary and Robert Williams Sr
Bought by
Williams Sakina
Create a Home Valuation Report for This Property
The Home Valuation Report is an in-depth analysis detailing your home's value as well as a comparison with similar homes in the area
Home Values in the Area
Average Home Value in this Area
Purchase History
| Date | Buyer | Sale Price | Title Company |
|---|---|---|---|
| Muharram Llc | -- | -- | |
| Muharram Llc | -- | -- | |
| Abdullah Mahdi N | $912,500 | -- | |
| Abdullah Mahdi N | $912,500 | -- | |
| Williams Sakina | -- | -- | |
| Williams Sakina | -- | -- |
Source: Public Records
Mortgage History
| Date | Status | Borrower | Loan Amount |
|---|---|---|---|
| Open | Muharram Llc | $250,000 | |
| Closed | Muharram Llc | $250,000 | |
| Previous Owner | Abdullah Mahdi N | $742,775 |
Source: Public Records
Tax History Compared to Growth
Tax History
| Year | Tax Paid | Tax Assessment Tax Assessment Total Assessment is a certain percentage of the fair market value that is determined by local assessors to be the total taxable value of land and additions on the property. | Land | Improvement |
|---|---|---|---|---|
| 2025 | $3,966 | $65,880 | $10,740 | $55,140 |
| 2024 | $3,966 | $55,920 | $10,740 | $45,180 |
| 2023 | $3,915 | $64,500 | $10,740 | $53,760 |
| 2022 | $3,711 | $58,620 | $10,740 | $47,880 |
| 2021 | $3,690 | $64,260 | $10,740 | $53,520 |
| 2020 | $1,731 | $43,500 | $10,740 | $32,760 |
| 2019 | $3,442 | $43,500 | $10,740 | $32,760 |
| 2018 | $3,275 | $16,065 | $3,896 | $12,169 |
| 2017 | $3,157 | $15,489 | $3,573 | $11,916 |
| 2016 | $2,921 | $14,613 | $4,549 | $10,064 |
| 2015 | $1,787 | $13,786 | $5,598 | $8,188 |
| 2014 | $1,787 | $13,712 | $5,568 | $8,144 |
Source: Public Records
Map
Nearby Homes
- 2817 W 20th St
- 2837 W 19th St Unit 3B
- 2837 W 19th St Unit 3A
- 2837 W 19th St Unit 2B
- 2837 W 19th St Unit 2A
- 2818 W 17th St Unit 1B
- 2819 W 17th St Unit 4B
- 2819 W 17th St Unit 2B
- 2819 W 17th St Unit 1A
- 2819 W 17th St Unit 4A
- 2819 W 17th St Unit 2A
- 2847 W 17th St
- 2869 W 17th St
- 2860 W 16th St Unit 2862
- 2860 W 22nd St
- 2878 W 16th St
- 1609 Mermaid Ave
- 2118 Mermaid Ave
- 2848 W 15th St
- 2231 Mermaid Ave
- 2841 W 20th St
- 2839 W 20th St
- 2845 W 20th St
- 2845 W 20 St
- 2847 W 20th St
- 2837 W 20th St
- 2849 W 20th St
- 2835 W 20th St
- 2851 W 20th St
- 2831 W 20th St
- 2853 W 20th St
- 2829 W 20th St Unit 1B
- 2829 W 20th St Unit 5
- 2855 W 20th St
- 2838 W 19th St
- 2840 W 19th St
- 19TH West St
- 2857 W 20th St
- 2836 W 19th St
- 2836 W 19th St Unit 3