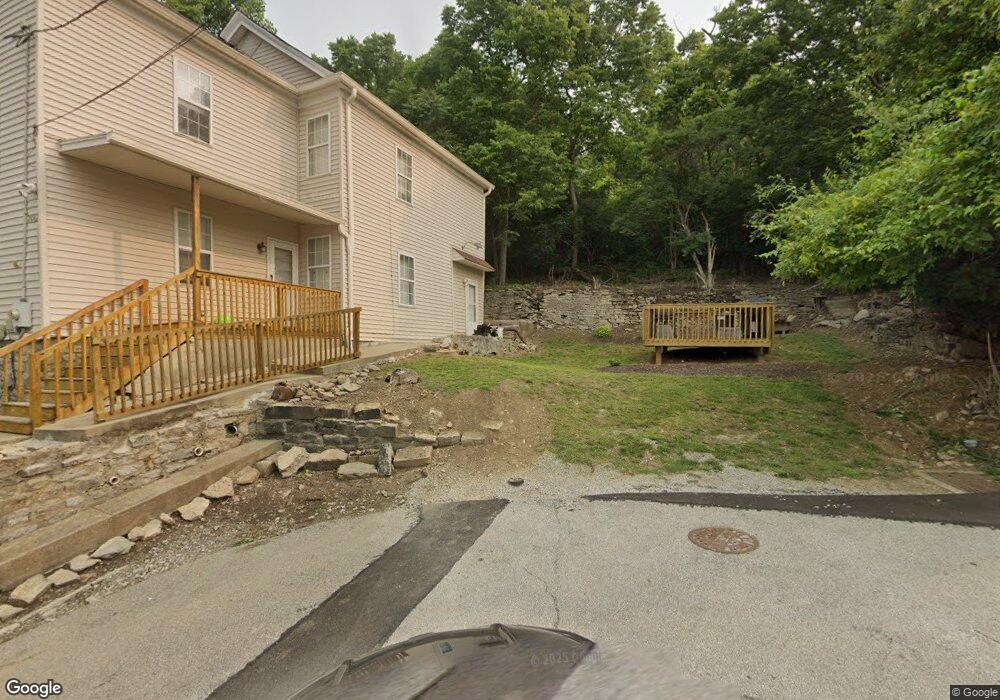
2842 Hoff Ave Cincinnati, OH 45226
East End NeighborhoodEstimated Value: $205,000 - $347,000
3
Beds
2
Baths
1,636
Sq Ft
$171/Sq Ft
Est. Value
About This Home
This home is located at 2842 Hoff Ave, Cincinnati, OH 45226 and is currently estimated at $278,979, approximately $170 per square foot. 2842 Hoff Ave is a home located in Hamilton County with nearby schools including Clark Montessori High School, Withrow University High School, and Robert A. Taft Information Technology High School.
Ownership History
Date
Name
Owned For
Owner Type
Purchase Details
Closed on
Oct 7, 2008
Sold by
Wm Specialty Mortgage Llc
Bought by
Thompson Fawn
Current Estimated Value
Purchase Details
Closed on
Jan 15, 2008
Sold by
Whitehead Brown Carolyn J and Brown Alex D
Bought by
Wm Specialty Mortgage Llc
Purchase Details
Closed on
Aug 11, 2006
Sold by
Estate Of Alex Brown Jr
Bought by
Brown Alex D
Purchase Details
Closed on
Oct 8, 2004
Sold by
Brown Alex and Whitehead Brown Carolyn J
Bought by
Brown Alex
Home Financials for this Owner
Home Financials are based on the most recent Mortgage that was taken out on this home.
Original Mortgage
$218,526
Interest Rate
7.6%
Mortgage Type
New Conventional
Purchase Details
Closed on
Dec 5, 1996
Sold by
Campbell Margaret Brown
Bought by
Brown Alex
Create a Home Valuation Report for This Property
The Home Valuation Report is an in-depth analysis detailing your home's value as well as a comparison with similar homes in the area
Home Values in the Area
Average Home Value in this Area
Purchase History
| Date | Buyer | Sale Price | Title Company |
|---|---|---|---|
| Thompson Fawn | $21,000 | Attorney | |
| Wm Specialty Mortgage Llc | $50,000 | None Available | |
| Brown Alex D | -- | None Available | |
| Brown Alex | -- | -- | |
| Brown Alex | -- | -- |
Source: Public Records
Mortgage History
| Date | Status | Borrower | Loan Amount |
|---|---|---|---|
| Previous Owner | Brown Alex | $218,526 |
Source: Public Records
Tax History
| Year | Tax Paid | Tax Assessment Tax Assessment Total Assessment is a certain percentage of the fair market value that is determined by local assessors to be the total taxable value of land and additions on the property. | Land | Improvement |
|---|---|---|---|---|
| 2025 | $2,538 | $39,774 | $4,998 | $34,776 |
| 2023 | $2,539 | $39,774 | $4,998 | $34,776 |
| 2022 | $1,973 | $27,752 | $3,353 | $24,399 |
| 2021 | $1,934 | $27,685 | $3,353 | $24,332 |
| 2020 | $1,935 | $27,685 | $3,353 | $24,332 |
| 2019 | $1,863 | $24,283 | $2,940 | $21,343 |
| 2018 | $1,864 | $24,283 | $2,940 | $21,343 |
| 2017 | $1,795 | $24,283 | $2,940 | $21,343 |
| 2016 | $576 | $7,498 | $3,000 | $4,498 |
| 2015 | $516 | $7,498 | $3,000 | $4,498 |
| 2014 | $518 | $7,498 | $3,000 | $4,498 |
| 2013 | $516 | $7,350 | $2,940 | $4,410 |
Source: Public Records
Map
Nearby Homes
- 2828 Hoff Ave
- 2851 Hoff Ave
- 312 Audubon St
- 2764 Hoff Ave
- 253 Saint Peters St
- 2734 Hoff Ave
- 3021 Riverside Dr
- 3219 Riverside Dr
- 3108 Walworth Ave
- 2833 Grandin Hollow Ln
- 2580 Riverside Dr
- 3120 Walworth Ave
- 3104 Walworth Ave
- 3096 Walworth Ave
- 260 Watson St
- 3304 Columbia Pkwy
- 259 Strader Ave
- 416 Torrence Ct
- 261 Strader Ave
- 263 Strader Ave
- 2846 Hoff Ave
- 2843 Hoff Ave
- 2841 Hoff Ave
- 2845 Hoff Ave
- 2837 Hoff Ave
- 2835 Hoff Ave
- 2833 Hoff Ave
- 326 Audubon St
- 328 Audubon St
- 314 Audubon St
- 2879 Walworth Ave
- 2818 Hoff Ave
- 2891 Walworth Ave
- 325 Audubon St
- 39 Weebetook Ln
- 2812 Hoff Ave
- 2897 Walworth Ave Unit lot36
- 2897 Walworth Ave Unit lot18
- 2897 Walworth Ave Unit Lt 36
- 2889 Riverside Dr
Your Personal Tour Guide
Ask me questions while you tour the home.