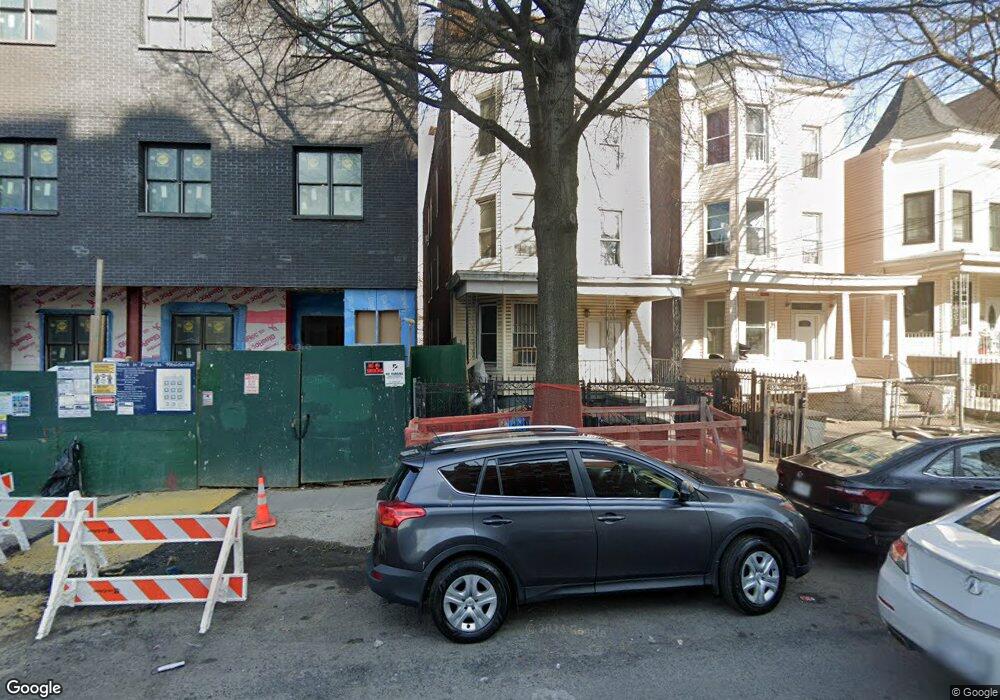
2845 Bainbridge Ave Bronx, NY 10458
Bedford Park NeighborhoodEstimated Value: $672,000 - $1,326,000
Studio
--
Bath
3,717
Sq Ft
$243/Sq Ft
Est. Value
About This Home
This home is located at 2845 Bainbridge Ave, Bronx, NY 10458 and is currently estimated at $902,890, approximately $242 per square foot. 2845 Bainbridge Ave is a home located in Bronx County with nearby schools including Ps 20 George J Werdan Iii, J.H.S. 080 The Mosholu Parkway, and Children's Aid College Preparatory Charter School.
Ownership History
Date
Name
Owned For
Owner Type
Purchase Details
Closed on
Sep 2, 2022
Sold by
Adefolayan Finbar A and Adefolayan Finbarr A
Bought by
2845 Management Llc
Current Estimated Value
Purchase Details
Closed on
Oct 22, 2004
Sold by
Scott Lorna
Bought by
Adefolayan Finbar A
Home Financials for this Owner
Home Financials are based on the most recent Mortgage that was taken out on this home.
Original Mortgage
$344,000
Interest Rate
5.75%
Mortgage Type
Purchase Money Mortgage
Purchase Details
Closed on
Dec 7, 1998
Sold by
Reid Joan
Bought by
Scott Lorna
Home Financials for this Owner
Home Financials are based on the most recent Mortgage that was taken out on this home.
Original Mortgage
$231,085
Interest Rate
6.83%
Mortgage Type
FHA
Create a Home Valuation Report for This Property
The Home Valuation Report is an in-depth analysis detailing your home's value as well as a comparison with similar homes in the area
Home Values in the Area
Average Home Value in this Area
Purchase History
| Date | Buyer | Sale Price | Title Company |
|---|---|---|---|
| 2845 Management Llc | $620,000 | -- | |
| Adefolayan Finbar A | $430,000 | -- | |
| Scott Lorna | $244,000 | Commonwealth Land Title Ins |
Source: Public Records
Mortgage History
| Date | Status | Borrower | Loan Amount |
|---|---|---|---|
| Previous Owner | Adefolayan Finbar A | $344,000 | |
| Previous Owner | Scott Lorna | $231,085 |
Source: Public Records
Tax History
| Year | Tax Paid | Tax Assessment Tax Assessment Total Assessment is a certain percentage of the fair market value that is determined by local assessors to be the total taxable value of land and additions on the property. | Land | Improvement |
|---|---|---|---|---|
| 2025 | $6,397 | $33,760 | $6,889 | $26,871 |
| 2024 | $6,397 | $31,849 | $6,617 | $25,232 |
| 2023 | $6,468 | $31,849 | $6,757 | $25,092 |
| 2022 | $6,310 | $47,520 | $10,260 | $37,260 |
| 2021 | $6,275 | $49,920 | $10,260 | $39,660 |
| 2020 | $5,955 | $43,200 | $10,260 | $32,940 |
| 2019 | $5,552 | $40,380 | $10,260 | $30,120 |
| 2018 | $5,410 | $26,541 | $6,804 | $19,737 |
| 2017 | $5,369 | $26,339 | $8,219 | $18,120 |
| 2016 | $4,968 | $24,849 | $7,442 | $17,407 |
| 2015 | $2,997 | $23,444 | $7,912 | $15,532 |
| 2014 | $2,997 | $22,118 | $7,870 | $14,248 |
Source: Public Records
Map
Nearby Homes
- 2862 Briggs Ave
- 2875 Briggs Ave
- 2877 Briggs Ave
- 2830 Briggs Ave Unit WIA
- 2830 Briggs Ave Unit 4-H
- 2830 Briggs Ave Unit 4-E
- 2830 Briggs Ave Unit 5-G
- 330 E 198th St
- 2866 Marion Ave Unit 6J
- 2866 Marion Ave Unit 3J
- 2866 Marion Ave Unit 4C
- 110 E 198th St
- 2969 Perry Ave
- 2819 Creston Ave
- 398 Oliver Place Unit 1A
- 2746B Creston Ave
- 2767 Creston Ave
- 2765 Creston Ave
- 3000 Valentine Ave Unit 5G
- 3000 Valentine Ave Unit 2E
- 2847 Bainbridge Ave
- 2843 Bainbridge Ave
- 2849 Bainbridge Ave
- 273-275 E 198th St
- 277 E 198th St
- 271 E 198th St
- 2853 Bainbridge Ave
- 2858 Briggs Ave
- 2860 Briggs Ave
- 2855 Bainbridge Ave
- 2854 Briggs Ave
- 2856 Briggs Ave Unit 2
- 2856 Briggs Ave Unit 1
- 2864 Briggs Ave
- 269 E 198th St
- 2866 Briggs Ave
- 2868 Briggs Ave
- 2870 Briggs Ave
- 267 E 198th St
- 2872 Briggs Ave
Your Personal Tour Guide
Ask me questions while you tour the home.