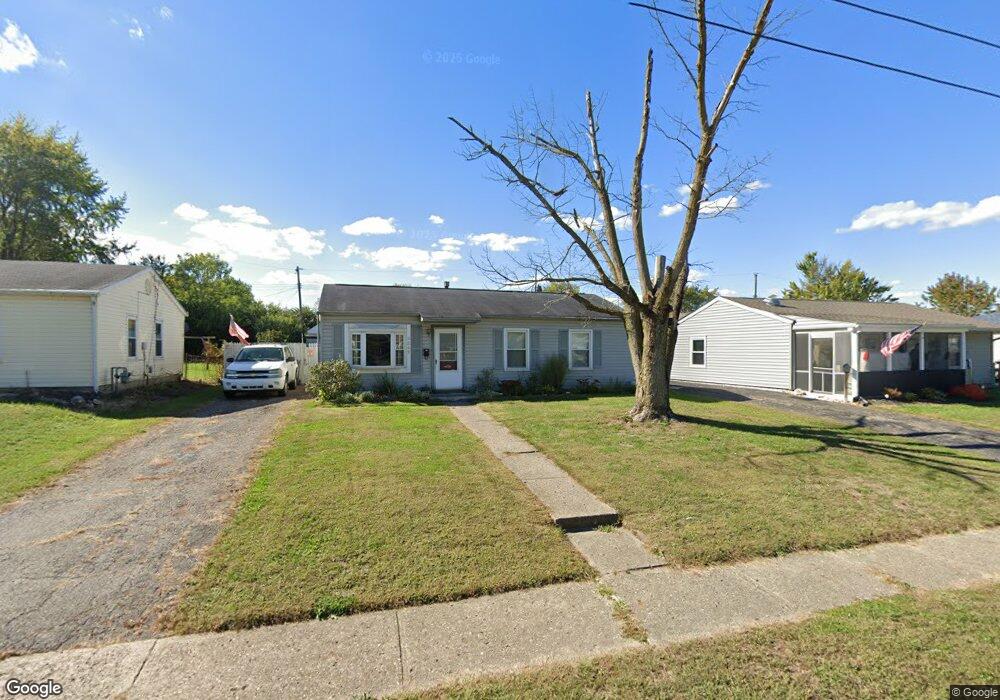
2845 Gibson Dr Columbus, OH 43207
Obetz-Lockbourne NeighborhoodEstimated Value: $198,000 - $227,000
4
Beds
2
Baths
1,443
Sq Ft
$150/Sq Ft
Est. Value
About This Home
This home is located at 2845 Gibson Dr, Columbus, OH 43207 and is currently estimated at $215,764, approximately $149 per square foot. 2845 Gibson Dr is a home located in Franklin County with nearby schools including Parsons Elementary School, Buckeye Middle School, and Marion-Franklin High School.
Ownership History
Date
Name
Owned For
Owner Type
Purchase Details
Closed on
Jul 31, 1997
Sold by
Castle Gladys M and Gallamore Brenda M
Bought by
Holland Yvonne F and Criner James H
Current Estimated Value
Home Financials for this Owner
Home Financials are based on the most recent Mortgage that was taken out on this home.
Original Mortgage
$65,925
Outstanding Balance
$10,003
Interest Rate
7.68%
Mortgage Type
FHA
Estimated Equity
$205,761
Purchase Details
Closed on
Apr 20, 1990
Create a Home Valuation Report for This Property
The Home Valuation Report is an in-depth analysis detailing your home's value as well as a comparison with similar homes in the area
Home Values in the Area
Average Home Value in this Area
Purchase History
| Date | Buyer | Sale Price | Title Company |
|---|---|---|---|
| Holland Yvonne F | $66,500 | -- | |
| -- | -- | -- |
Source: Public Records
Mortgage History
| Date | Status | Borrower | Loan Amount |
|---|---|---|---|
| Open | Holland Yvonne F | $65,925 |
Source: Public Records
Tax History Compared to Growth
Tax History
| Year | Tax Paid | Tax Assessment Tax Assessment Total Assessment is a certain percentage of the fair market value that is determined by local assessors to be the total taxable value of land and additions on the property. | Land | Improvement |
|---|---|---|---|---|
| 2024 | $3,015 | $62,510 | $16,030 | $46,480 |
| 2023 | $2,979 | $62,510 | $16,030 | $46,480 |
| 2022 | $1,529 | $25,940 | $10,290 | $15,650 |
| 2021 | $1,531 | $25,940 | $10,290 | $15,650 |
| 2020 | $894 | $25,940 | $10,290 | $15,650 |
| 2019 | $835 | $22,510 | $8,930 | $13,580 |
| 2018 | $935 | $22,510 | $8,930 | $13,580 |
| 2017 | $988 | $22,510 | $8,930 | $13,580 |
| 2016 | $1,141 | $25,980 | $4,310 | $21,670 |
| 2015 | $1,036 | $25,980 | $4,310 | $21,670 |
| 2014 | $1,039 | $25,980 | $4,310 | $21,670 |
| 2013 | $553 | $27,335 | $4,515 | $22,820 |
Source: Public Records
Map
Nearby Homes
- 162 Phelps Rd
- 2808 Dolby Dr
- 115 W Castle Rd
- 19 E Castle Rd
- 145 Ziegler Ave
- 164 E Alcott Rd
- 228 Currier Dr
- 84 Betz Rd
- 82 Delray Rd
- 2901 Parsons Ave
- 229 Southard Dr
- 3161 Lewis Rd
- 256 Rumsey Rd Unit 258
- 443 Carolann Ave
- 202 Williams Rd
- 3380 Parsons Ave
- 0 F Ave Unit 224036459
- 400 Colton Rd
- 245 Marilla Rd
- 574 Koebel Ave