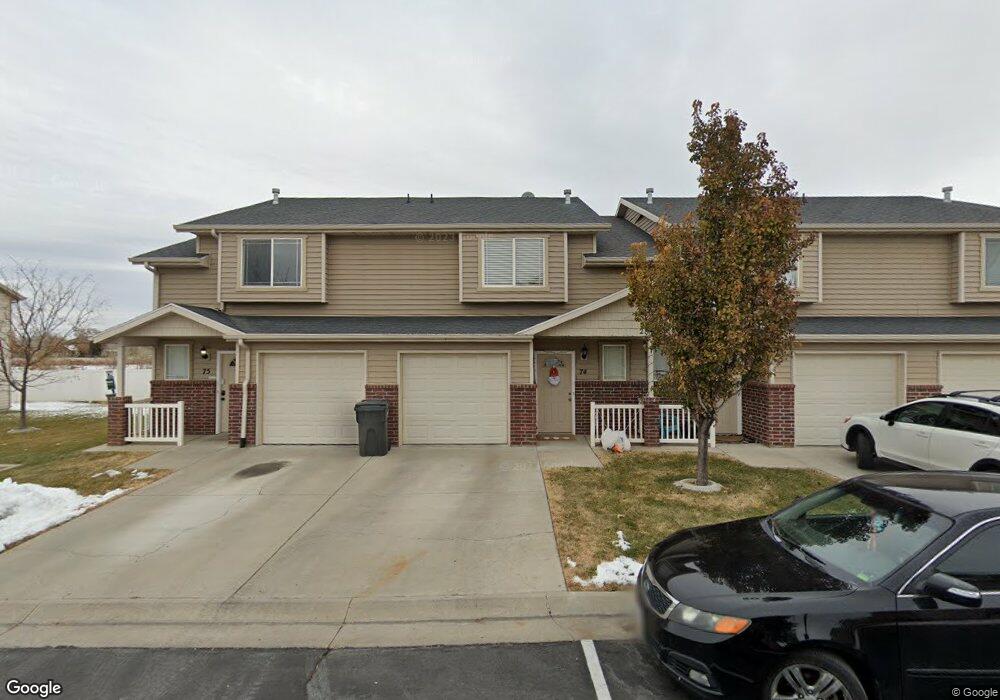
2846 W 3965 S Unit 75D West Haven, UT 84401
Estimated Value: $293,000 - $313,614
3
Beds
2
Baths
1,186
Sq Ft
$259/Sq Ft
Est. Value
About This Home
This home is located at 2846 W 3965 S Unit 75D, West Haven, UT 84401 and is currently estimated at $307,154, approximately $258 per square foot. 2846 W 3965 S Unit 75D is a home located in Weber County with nearby schools including Kanesville Elementary School, Rocky Mountain Junior High School, and Fremont High School.
Ownership History
Date
Name
Owned For
Owner Type
Purchase Details
Closed on
Sep 12, 2022
Sold by
Opendoor Property Trust
Bought by
Perez Matthew P
Current Estimated Value
Home Financials for this Owner
Home Financials are based on the most recent Mortgage that was taken out on this home.
Original Mortgage
$303,610
Outstanding Balance
$290,180
Interest Rate
5.3%
Mortgage Type
New Conventional
Estimated Equity
$16,974
Purchase Details
Closed on
Jun 9, 2022
Sold by
Richard Cheever
Bought by
Opendoor Property Trust
Purchase Details
Closed on
Feb 7, 2019
Sold by
Cheever Richard
Bought by
Cheever Richard and Cheever Elizabeth
Home Financials for this Owner
Home Financials are based on the most recent Mortgage that was taken out on this home.
Original Mortgage
$148,000
Interest Rate
4.5%
Mortgage Type
New Conventional
Create a Home Valuation Report for This Property
The Home Valuation Report is an in-depth analysis detailing your home's value as well as a comparison with similar homes in the area
Home Values in the Area
Average Home Value in this Area
Purchase History
| Date | Buyer | Sale Price | Title Company |
|---|---|---|---|
| Perez Matthew P | -- | Cottonwood Title | |
| Opendoor Property Trust | -- | Cottonwood Title | |
| Cheever Richard | -- | Us Title Insurance Agency |
Source: Public Records
Mortgage History
| Date | Status | Borrower | Loan Amount |
|---|---|---|---|
| Open | Perez Matthew P | $303,610 | |
| Previous Owner | Cheever Richard | $148,000 |
Source: Public Records
Tax History Compared to Growth
Tax History
| Year | Tax Paid | Tax Assessment Tax Assessment Total Assessment is a certain percentage of the fair market value that is determined by local assessors to be the total taxable value of land and additions on the property. | Land | Improvement |
|---|---|---|---|---|
| 2025 | $1,669 | $304,420 | $85,000 | $219,420 |
| 2024 | $1,617 | $163,350 | $46,750 | $116,600 |
| 2023 | $1,569 | $156,200 | $46,750 | $109,450 |
| 2022 | $1,668 | $308,000 | $85,000 | $223,000 |
| 2021 | $1,369 | $231,000 | $30,000 | $201,000 |
| 2020 | $1,261 | $195,000 | $30,000 | $165,000 |
| 2019 | $1,188 | $174,000 | $25,000 | $149,000 |
| 2018 | $1,100 | $154,000 | $21,000 | $133,000 |
| 2017 | $943 | $128,000 | $21,000 | $107,000 |
| 2016 | $886 | $64,900 | $11,550 | $53,350 |
| 2015 | $865 | $62,700 | $11,550 | $51,150 |
| 2014 | $814 | $57,750 | $11,550 | $46,200 |
Source: Public Records
Map
Nearby Homes
- 2917 W 3970 S Unit 53
- 3891 S 2940 W
- 4022 S 2725 W
- 3866 S 2970 W
- 3860 S Midland Dr Unit B97
- 3860 S Midland Dr Unit B59
- 3860 S Midland Dr Unit B 51
- 2778 W 4175 S Unit 235
- 2777 W 4175 S Unit 229
- 3750 S Midland Dr
- 4118 Westlake Dr
- 2835 W 4200 S
- 3114 S 3175 W Unit 21
- 3117 S 3175 W Unit 12
- 3111 S 3175 W Unit 11
- 3721 S 3175 W
- 3750 Midland Dr Unit 169
- 3229 W 3855 S
- 3639 S Macy Ln
- 3634 S Macy Ln
- 2846 W 3965 S Unit 73B
- 2846 W 3965 S Unit 72A
- 2824 W 3965 S Unit 71D
- 2824 W 3965 S Unit 70C
- 2824 W 3965 S Unit 69B
- 2824 W 3965 S Unit 68A
- 2824 W 3965 S
- 2856 W 3965 S Unit 79D
- 2856 W 3965 S Unit 76A
- 2814 W 3965 S Unit 67D
- 2814 W 3965 S Unit 66C
- 2814 W 3965 S Unit 65B
- 2814 W 3965 S Unit 64A
- 2814 W 3965 S
- 2827 W 3965 S Unit 59D
- 2827 W 3965 S Unit 58C
- 2827 W 3965 S Unit 57B
- 2827 W 3965 S Unit 56A
- 2817 W 3965 S Unit 63D
- 2817 W 3965 S Unit 62C