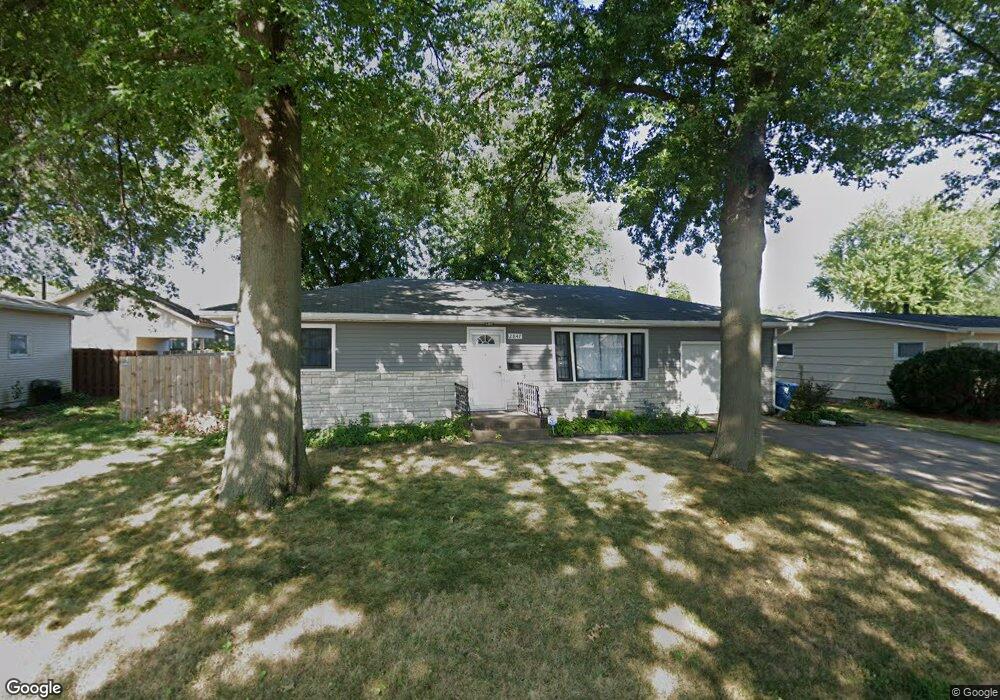
2847 7 1/2 St East Moline, IL 61244
Estimated Value: $141,000 - $181,000
--
Bed
2
Baths
888
Sq Ft
$186/Sq Ft
Est. Value
About This Home
This home is located at 2847 7 1/2 St, East Moline, IL 61244 and is currently estimated at $164,952, approximately $185 per square foot. 2847 7 1/2 St is a home located in Rock Island County with nearby schools including Ridgewood Elementary School, Glenview Middle School, and United Township High School.
Ownership History
Date
Name
Owned For
Owner Type
Purchase Details
Closed on
Jun 9, 2020
Sold by
Mendoza Gabriel L and Mendoza Sarah J
Bought by
Mcneal Derrick L and Salinas Cristel O
Current Estimated Value
Home Financials for this Owner
Home Financials are based on the most recent Mortgage that was taken out on this home.
Original Mortgage
$138,710
Outstanding Balance
$123,925
Interest Rate
3.63%
Mortgage Type
New Conventional
Estimated Equity
$41,027
Create a Home Valuation Report for This Property
The Home Valuation Report is an in-depth analysis detailing your home's value as well as a comparison with similar homes in the area
Home Values in the Area
Average Home Value in this Area
Purchase History
| Date | Buyer | Sale Price | Title Company |
|---|---|---|---|
| Mcneal Derrick L | $143,000 | Bozeman Neighbour Patton & Noe |
Source: Public Records
Mortgage History
| Date | Status | Borrower | Loan Amount |
|---|---|---|---|
| Open | Mcneal Derrick L | $138,710 |
Source: Public Records
Tax History Compared to Growth
Tax History
| Year | Tax Paid | Tax Assessment Tax Assessment Total Assessment is a certain percentage of the fair market value that is determined by local assessors to be the total taxable value of land and additions on the property. | Land | Improvement |
|---|---|---|---|---|
| 2024 | $3,253 | $38,391 | $11,585 | $26,806 |
| 2023 | $3,253 | $35,351 | $10,668 | $24,683 |
| 2022 | $2,751 | $32,310 | $9,750 | $22,560 |
| 2021 | $2,677 | $30,889 | $9,321 | $21,568 |
| 2020 | $2,646 | $30,372 | $9,165 | $21,207 |
| 2019 | $2,547 | $29,894 | $9,021 | $20,873 |
| 2018 | $2,547 | $29,445 | $8,886 | $20,559 |
| 2017 | $2,459 | $28,981 | $8,746 | $20,235 |
| 2016 | $2,993 | $28,083 | $8,475 | $19,608 |
| 2015 | $2,820 | $26,647 | $8,042 | $18,605 |
| 2014 | -- | $26,913 | $8,122 | $18,791 |
| 2013 | -- | $26,913 | $8,122 | $18,791 |
Source: Public Records
Map
Nearby Homes