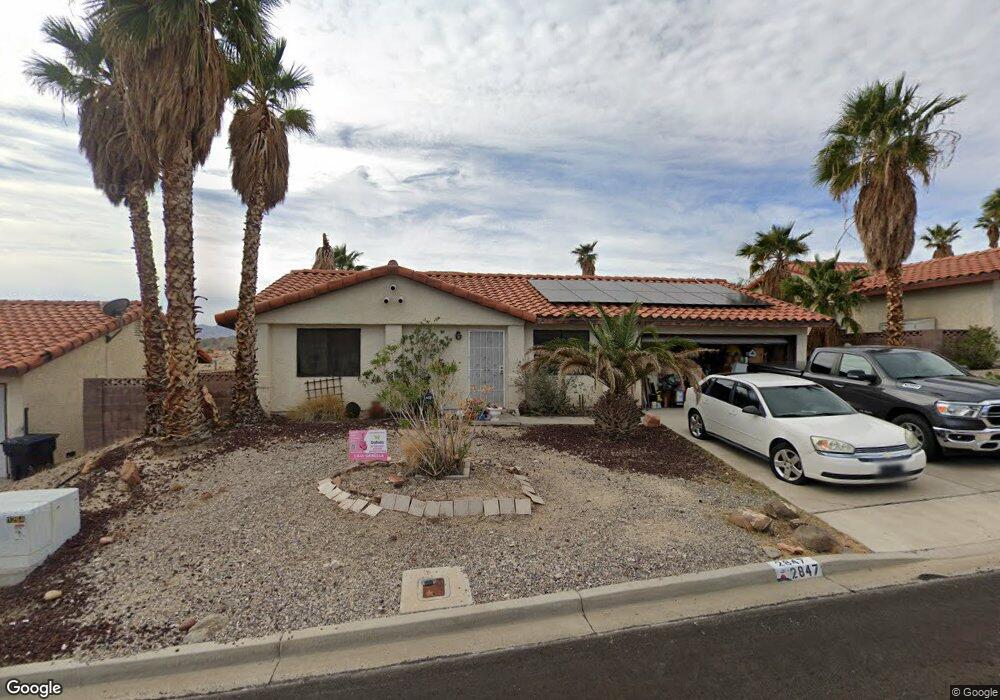
2847 Biscaya Dr Laughlin, NV 89029
Estimated Value: $266,896 - $334,000
2
Beds
2
Baths
1,056
Sq Ft
$282/Sq Ft
Est. Value
About This Home
This home is located at 2847 Biscaya Dr, Laughlin, NV 89029 and is currently estimated at $297,974, approximately $282 per square foot. 2847 Biscaya Dr is a home located in Clark County with nearby schools including William G. Bennett Elementary School and Laughlin Junior/Senior High School.
Ownership History
Date
Name
Owned For
Owner Type
Purchase Details
Closed on
May 1, 2009
Sold by
Wallace Eugene W and Gardner Wallace Stephanie L
Bought by
Wallace Eugene W and Gardner Wallace Stephanie L
Current Estimated Value
Purchase Details
Closed on
Jul 11, 2008
Sold by
Wallace Eugene W and Gardner Wallace Stephanie L
Bought by
Wallace Eugene W and Gardner Wallace Stephanie L
Purchase Details
Closed on
Oct 21, 2002
Sold by
Franks Thomas C and Franks Ruth
Bought by
Wallace Eugene W and Wallace Stephanie L Gardner
Home Financials for this Owner
Home Financials are based on the most recent Mortgage that was taken out on this home.
Original Mortgage
$155,040
Interest Rate
6.06%
Mortgage Type
VA
Purchase Details
Closed on
Oct 11, 2001
Sold by
Stovall Ronald and Stovall Leona M
Bought by
Franks Thomas C and Franks Ruth
Home Financials for this Owner
Home Financials are based on the most recent Mortgage that was taken out on this home.
Original Mortgage
$116,000
Interest Rate
6.84%
Purchase Details
Closed on
Jun 17, 1997
Sold by
Schipper Richard J
Bought by
Stovall Ronald and Stovall Leona M
Home Financials for this Owner
Home Financials are based on the most recent Mortgage that was taken out on this home.
Original Mortgage
$100,000
Interest Rate
7.57%
Create a Home Valuation Report for This Property
The Home Valuation Report is an in-depth analysis detailing your home's value as well as a comparison with similar homes in the area
Purchase History
| Date | Buyer | Sale Price | Title Company |
|---|---|---|---|
| Wallace Eugene W | -- | None Available | |
| Wallace Eugene W | -- | None Available | |
| Wallace Eugene W | $157,000 | Nevada Title Company | |
| Franks Thomas C | $145,000 | Nevada Title Company | |
| Stovall Ronald | $140,500 | Nevada Title Company |
Source: Public Records
Mortgage History
| Date | Status | Borrower | Loan Amount |
|---|---|---|---|
| Previous Owner | Wallace Eugene W | $155,040 | |
| Previous Owner | Franks Thomas C | $116,000 | |
| Previous Owner | Stovall Ronald | $100,000 |
Source: Public Records
Tax History
| Year | Tax Paid | Tax Assessment Tax Assessment Total Assessment is a certain percentage of the fair market value that is determined by local assessors to be the total taxable value of land and additions on the property. | Land | Improvement |
|---|---|---|---|---|
| 2026 | $1,438 | $53,736 | $12,950 | $40,786 |
| 2025 | $1,397 | $55,189 | $12,600 | $42,589 |
| 2024 | $1,357 | $55,189 | $12,600 | $42,589 |
| 2023 | $1,357 | $61,845 | $21,000 | $40,845 |
| 2022 | $1,317 | $53,976 | $16,100 | $37,876 |
| 2021 | $1,279 | $50,680 | $14,350 | $36,330 |
| 2020 | $1,240 | $50,392 | $14,000 | $36,392 |
| 2019 | $1,203 | $47,719 | $11,550 | $36,169 |
| 2018 | $1,168 | $46,369 | $11,200 | $35,169 |
| 2017 | $1,532 | $45,750 | $9,800 | $35,950 |
| 2016 | $1,106 | $46,335 | $9,800 | $36,535 |
| 2015 | $1,103 | $41,400 | $8,750 | $32,650 |
| 2014 | $1,071 | $31,063 | $7,000 | $24,063 |
Source: Public Records
Map
Nearby Homes
- 1826 Dunes Ct
- 1940 Las Palmas Ln Unit 171
- 1940 Las Palmas Ln Unit 272
- 2888 Cattail Cove St
- 1972 Las Palmas Ln Unit 251
- 1972 Las Palmas Ln Unit 249
- 1948 Las Palmas Ln Unit 277
- 1948 Las Palmas Ln Unit 279
- 1928 Las Palmas Ln Unit 228
- 2926 Shimmering Bay St
- 2078 Willow Bay Rd
- 1964 Las Palmas Ln Unit 141
- 2772 Brinkley Manor St
- 2061 Hunt Woods Ct
- 2748 Brinkley Manor St
- 2081 Hunt Woods Ct
- 2061 Alki Beach Ave
- 2077 Alki Beach Ave
- 2175 Limestone Cove Ct
- 2184 Camel Mesa Dr
- 2855 Biscaya Dr
- 2839 Biscaya Dr
- 2863 Biscaya Dr
- 2831 W Biscaya
- 2831 Biscaya Dr
- 2840 Biscaya Dr
- 2848 Biscaya Dr
- 2856 Biscaya Dr
- 2871 Biscaya Dr
- 2832 Biscaya Dr
- 2864 Biscaya Dr
- 2879 Biscaya Dr
- 2824 Biscaya Dr
- 1870 Palmera Ct
- 1859 Palmera Ct
- 2872 Biscaya Dr
- 2815 Biscaya Dr
- 2887 Biscaya Dr
- 1941 Mimosa Ct
- 1881 Maricopa Dr
Your Personal Tour Guide
Ask me questions while you tour the home.