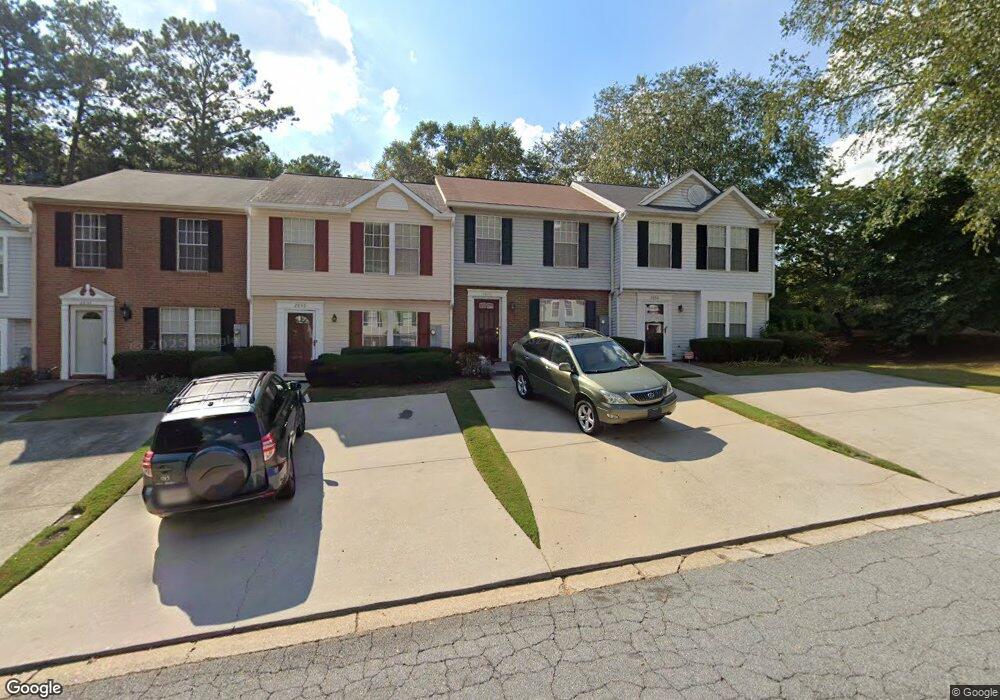
2848 Dresden Square Dr Atlanta, GA 30341
Estimated Value: $272,162 - $308,000
2
Beds
3
Baths
1,300
Sq Ft
$225/Sq Ft
Est. Value
About This Home
This home is located at 2848 Dresden Square Dr, Atlanta, GA 30341 and is currently estimated at $292,291, approximately $224 per square foot. 2848 Dresden Square Dr is a home located in DeKalb County with nearby schools including Dresden Elementary School, Sequoyah Middle School, and Cross Keys High School.
Ownership History
Date
Name
Owned For
Owner Type
Purchase Details
Closed on
Oct 6, 2000
Sold by
Prybys Leslie A
Bought by
Fenn Janet N
Current Estimated Value
Home Financials for this Owner
Home Financials are based on the most recent Mortgage that was taken out on this home.
Original Mortgage
$117,600
Outstanding Balance
$42,436
Interest Rate
7.96%
Mortgage Type
New Conventional
Estimated Equity
$249,855
Purchase Details
Closed on
Mar 8, 1999
Sold by
Chance John T
Bought by
Prybys Leslie A
Home Financials for this Owner
Home Financials are based on the most recent Mortgage that was taken out on this home.
Original Mortgage
$119,200
Interest Rate
6.82%
Mortgage Type
New Conventional
Purchase Details
Closed on
Oct 27, 1993
Sold by
Brown Holly V
Bought by
Chance John T
Home Financials for this Owner
Home Financials are based on the most recent Mortgage that was taken out on this home.
Original Mortgage
$84,337
Interest Rate
9%
Mortgage Type
FHA
Create a Home Valuation Report for This Property
The Home Valuation Report is an in-depth analysis detailing your home's value as well as a comparison with similar homes in the area
Home Values in the Area
Average Home Value in this Area
Purchase History
| Date | Buyer | Sale Price | Title Company |
|---|---|---|---|
| Fenn Janet N | $147,000 | -- | |
| Prybys Leslie A | $125,500 | -- | |
| Chance John T | $5,900 | -- |
Source: Public Records
Mortgage History
| Date | Status | Borrower | Loan Amount |
|---|---|---|---|
| Open | Fenn Janet N | $117,600 | |
| Previous Owner | Prybys Leslie A | $119,200 | |
| Previous Owner | Chance John T | $84,337 |
Source: Public Records
Tax History Compared to Growth
Tax History
| Year | Tax Paid | Tax Assessment Tax Assessment Total Assessment is a certain percentage of the fair market value that is determined by local assessors to be the total taxable value of land and additions on the property. | Land | Improvement |
|---|---|---|---|---|
| 2025 | $3,001 | $102,000 | $19,380 | $82,620 |
| 2024 | $3,136 | $107,920 | $20,000 | $87,920 |
| 2023 | $3,136 | $79,920 | $15,984 | $63,936 |
| 2022 | $2,351 | $79,920 | $15,984 | $63,936 |
| 2021 | $1,784 | $79,920 | $15,920 | $64,000 |
| 2020 | $1,829 | $64,000 | $15,360 | $48,640 |
| 2019 | $2,080 | $74,520 | $15,920 | $58,600 |
| 2018 | $1,135 | $67,000 | $15,920 | $51,080 |
| 2017 | $1,722 | $52,200 | $17,000 | $35,200 |
| 2016 | $1,678 | $52,200 | $17,000 | $35,200 |
| 2014 | $935 | $31,200 | $16,800 | $14,400 |
Source: Public Records
Map
Nearby Homes
- 2710 Dresden Dr
- 2710 Dresden Dr
- 2910 Marlin Dr
- 2920 Appling Dr
- 3125 Colonial Way Unit D
- 3071 Colonial Way Unit K
- 3071 Colonial Way Unit J
- 3087 Colonial Way Unit J
- 3079 Colonial Way Unit J
- 3083 Colonial Way
- 3091 Colonial Way Unit F2
- 3091 Colonial Way Unit J3
- 3107 Colonial Way Unit F
- 2844 Whispering Hills Dr
- 2899 Shallowford Rd NE
- 2608 Woodgreen Dr
- 2526 Cosmos Dr NE
- 2762 Dresden Dr NE
- 2942 Arrow Creek Dr
- 2846 Dresden Square Dr
- 2850 Dresden Square Dr
- 2844 Dresden Square Dr
- 2842 Dresden Square Dr
- 2866 Dresden Square Dr
- 2840 Dresden Square Dr
- 2868 Dresden Square Dr
- 2870 Dresden Square Dr
- 2855 Dresden Square Dr
- 2872 Dresden Square Dr
- 2845 Dresden Square Dr
- 2849 Dresden Square Dr
- 2847 Dresden Square Dr Unit 2847
- 2847 Dresden Square Dr
- 0 Dresden Square Dr Unit 7111967
- 0 Dresden Square Dr Unit 7012203
- 0 Dresden Square Dr Unit 3168114
- 0 Dresden Square Dr Unit 8145664
- 0 Dresden Square Dr Unit 7111343
- 0 Dresden Square Dr