Estimated Value: $629,000 - $667,000
5
Beds
3
Baths
3,623
Sq Ft
$179/Sq Ft
Est. Value
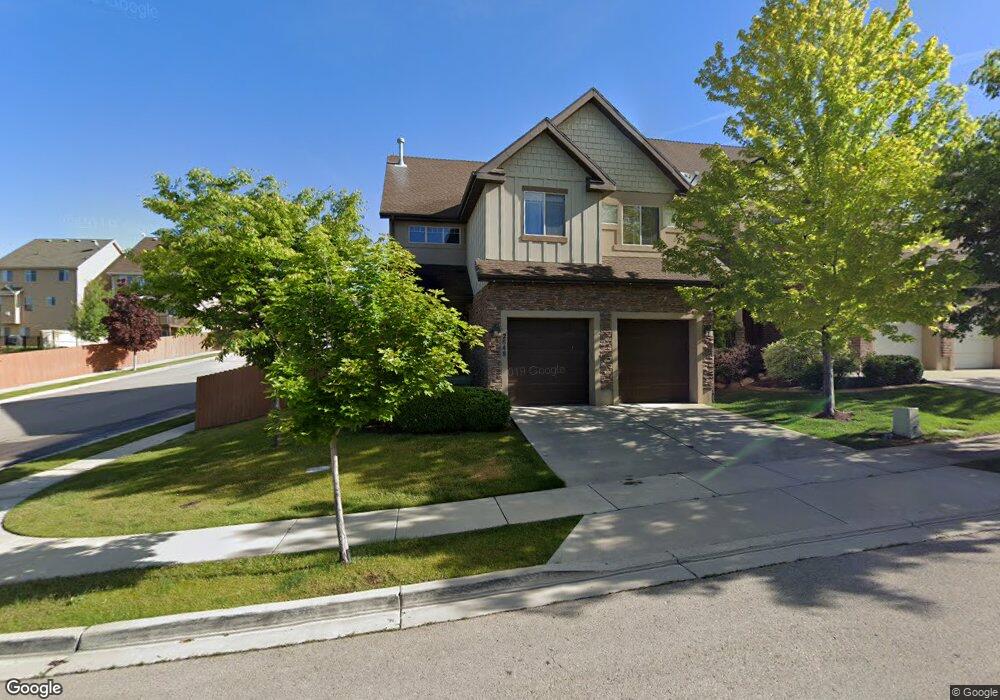
About This Home
This home is located at 2848 W Fox Hunters Loop, Lehi, UT 84043 and is currently estimated at $648,539, approximately $179 per square foot. 2848 W Fox Hunters Loop is a home located in Utah County with nearby schools including Traverse Mountain Elementary School, Skyridge High School, and Ignite Entrepreneurship Academy.
Ownership History
Date
Name
Owned For
Owner Type
Purchase Details
Closed on
Aug 2, 2011
Sold by
Hendrickson Scott
Bought by
Emigh Christopher J and Emigh Raveny R
Current Estimated Value
Home Financials for this Owner
Home Financials are based on the most recent Mortgage that was taken out on this home.
Original Mortgage
$200,450
Outstanding Balance
$138,075
Interest Rate
4.46%
Mortgage Type
New Conventional
Estimated Equity
$510,464
Purchase Details
Closed on
Nov 21, 2006
Sold by
Tran Nguyen
Bought by
Ferguson Kelly C and Ferguson Amanda M
Home Financials for this Owner
Home Financials are based on the most recent Mortgage that was taken out on this home.
Original Mortgage
$82,000
Interest Rate
6.32%
Mortgage Type
Stand Alone Second
Purchase Details
Closed on
Sep 26, 2006
Sold by
J Ballard Homes Inc
Bought by
Tran Nguyen
Home Financials for this Owner
Home Financials are based on the most recent Mortgage that was taken out on this home.
Original Mortgage
$246,000
Interest Rate
6.37%
Mortgage Type
Purchase Money Mortgage
Create a Home Valuation Report for This Property
The Home Valuation Report is an in-depth analysis detailing your home's value as well as a comparison with similar homes in the area
Home Values in the Area
Average Home Value in this Area
Purchase History
| Date | Buyer | Sale Price | Title Company |
|---|---|---|---|
| Emigh Christopher J | -- | Affiliated First Title Compa | |
| Ferguson Kelly C | -- | Equity Title Production F | |
| Tran Nguyen | -- | Lone Peak Title |
Source: Public Records
Mortgage History
| Date | Status | Borrower | Loan Amount |
|---|---|---|---|
| Open | Emigh Christopher J | $200,450 | |
| Previous Owner | Ferguson Kelly C | $82,000 | |
| Previous Owner | Ferguson Kelly C | $246,000 |
Source: Public Records
Tax History
| Year | Tax Paid | Tax Assessment Tax Assessment Total Assessment is a certain percentage of the fair market value that is determined by local assessors to be the total taxable value of land and additions on the property. | Land | Improvement |
|---|---|---|---|---|
| 2025 | $2,786 | $337,920 | -- | -- |
| 2024 | $2,786 | $326,040 | $0 | $0 |
| 2023 | $2,658 | $337,700 | $0 | $0 |
| 2022 | $4,753 | $585,500 | $187,500 | $398,000 |
| 2021 | $4,311 | $441,600 | $117,200 | $324,400 |
| 2020 | $2,237 | $411,700 | $108,500 | $303,200 |
| 2019 | $2,076 | $397,300 | $108,500 | $288,800 |
| 2018 | $1,988 | $359,700 | $101,900 | $257,800 |
| 2017 | $1,881 | $180,895 | $0 | $0 |
| 2016 | $1,919 | $171,270 | $0 | $0 |
| 2015 | $1,882 | $159,390 | $0 | $0 |
| 2014 | $1,665 | $140,250 | $0 | $0 |
Source: Public Records
Map
Nearby Homes
- 5381 N Eagles View Dr
- 221 E Greyhawk Dr Unit 113
- 4901 N Eagle Nest Ln
- 4863 N Shady Bend Ln
- 2190 W Swift Fox Dr Unit 219
- 2284 W Northridge Dr
- 14911 Hidden Cove Way
- 2198 W Northridge Dr
- 2191 W Northridge Dr
- 2203 W Swift Fox Dr Unit 272
- 2197 W Swift Fox Dr Unit 273
- 2185 W Swift Fox Dr Unit 275
- 4708 N Sunset Way
- 4665 N Stonehaven Loop
- 5369 N Lookout Cove
- 5369 N Lookout Cove Unit 114
- 5372 N Lookout Cove Unit 117
- 5330 N Springview Ct
- 5488 N Valley View Rd
- 1876 W Oakwood Cir
- 2848 Fox Hunters Loop
- 2836 Fox Hunters Loop
- 2824 W Fox Hunters Loop
- 2824 Fox Hunters Loop
- 2878 Fox Hunters Loop
- 2878 W Fox Hunters Loop
- 2841 Chestnut St
- 2841 W Chestnut St
- 2831 Chestnut St
- 2831 W Chestnut St
- 2812 Fox Hunters Loop
- 2821 Chestnut St
- 2886 Fox Hunters Loop
- 2869 Chestnut St
- 2843 Fox Hunters Loop
- 2855 Fox Hunters Loop
- 2863 W Fox Hunters Loop
- 2802 W Fox Hunters Loop
- 2863 Fox Hunters Loop
- 2821 W Fox Hunters Loop
Your Personal Tour Guide
Ask me questions while you tour the home.