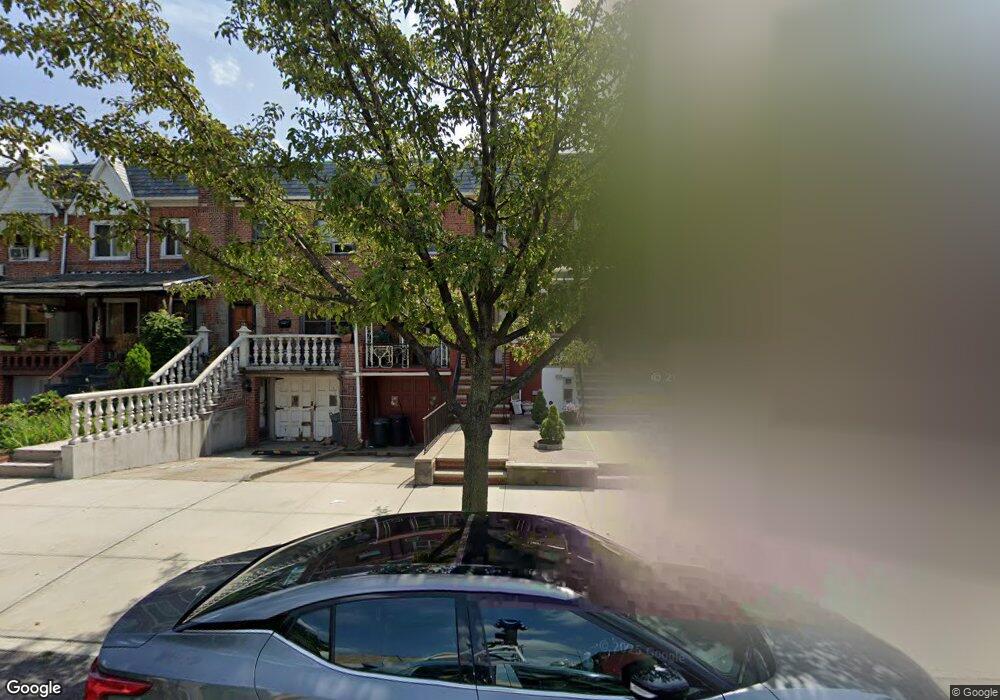
2849 50th St Woodside, NY 11377
Woodside NeighborhoodEstimated Value: $955,000 - $1,236,000
--
Bed
--
Bath
1,831
Sq Ft
$578/Sq Ft
Est. Value
About This Home
This home is located at 2849 50th St, Woodside, NY 11377 and is currently estimated at $1,057,624, approximately $577 per square foot. 2849 50th St is a home located in Queens County with nearby schools including P.S. 151 - Mary D. Carter, I.S. 010 Horace Greeley, and William Cullen Bryant High School.
Ownership History
Date
Name
Owned For
Owner Type
Purchase Details
Closed on
Aug 16, 2001
Sold by
Jozic Branko and Jozic Vicky
Bought by
Devera Irma and Devera Clemante
Current Estimated Value
Home Financials for this Owner
Home Financials are based on the most recent Mortgage that was taken out on this home.
Original Mortgage
$275,000
Outstanding Balance
$105,411
Interest Rate
6.91%
Estimated Equity
$952,213
Purchase Details
Closed on
Apr 23, 2001
Sold by
Mcdonough Theresa
Bought by
Jozic Branko and Jozic Jozic
Home Financials for this Owner
Home Financials are based on the most recent Mortgage that was taken out on this home.
Original Mortgage
$200,000
Interest Rate
6.85%
Purchase Details
Closed on
Feb 28, 2001
Sold by
Buckley Dorothy R and Mc Donough Theresa
Bought by
Mcdonough Theresa
Home Financials for this Owner
Home Financials are based on the most recent Mortgage that was taken out on this home.
Original Mortgage
$200,000
Interest Rate
6.85%
Purchase Details
Closed on
Nov 20, 2000
Sold by
Mcdonough Theresa
Bought by
Buckley Dorothy R
Create a Home Valuation Report for This Property
The Home Valuation Report is an in-depth analysis detailing your home's value as well as a comparison with similar homes in the area
Home Values in the Area
Average Home Value in this Area
Purchase History
| Date | Buyer | Sale Price | Title Company |
|---|---|---|---|
| Devera Irma | -- | -- | |
| Jozic Branko | -- | -- | |
| Mcdonough Theresa | -- | -- | |
| Buckley Dorothy R | -- | Stewart Title Insurance Co |
Source: Public Records
Mortgage History
| Date | Status | Borrower | Loan Amount |
|---|---|---|---|
| Open | Devera Irma | $275,000 | |
| Previous Owner | Jozic Branko | $200,000 |
Source: Public Records
Tax History Compared to Growth
Tax History
| Year | Tax Paid | Tax Assessment Tax Assessment Total Assessment is a certain percentage of the fair market value that is determined by local assessors to be the total taxable value of land and additions on the property. | Land | Improvement |
|---|---|---|---|---|
| 2025 | $8,364 | $45,624 | $14,395 | $31,229 |
| 2024 | $5,485 | $43,042 | $13,361 | $29,681 |
| 2023 | $7,875 | $40,608 | $13,914 | $26,694 |
| 2022 | $7,781 | $55,440 | $18,420 | $37,020 |
| 2021 | $8,185 | $59,280 | $18,420 | $40,860 |
| 2020 | $7,752 | $61,440 | $18,420 | $43,020 |
| 2019 | $7,210 | $60,060 | $18,420 | $41,640 |
| 2018 | $6,601 | $33,840 | $11,268 | $22,572 |
| 2017 | $6,566 | $33,679 | $11,898 | $21,781 |
| 2016 | $6,404 | $33,679 | $11,898 | $21,781 |
| 2015 | $3,612 | $31,683 | $19,751 | $11,932 |
| 2014 | $3,612 | $29,890 | $19,526 | $10,364 |
Source: Public Records
Map
Nearby Homes
- 51-28 30th Ave Unit 6A
- 51-40 30th Ave Unit 4H
- 3015 Hobart St Unit 4
- 30-31 Hobart St Unit 6N
- 4811 30th Ave
- 3040 Hobart St
- 3045 Hobart St Unit 4H
- 30-47 Hobart St Unit DDB
- 30- 47 Hobart St Unit 6
- 30-47 Hobart St Unit 5K
- 3005 48th St
- 25-69 49th St
- 55-03 31st Ave Unit C6K
- 5607 31st Ave Unit 1B
- 2570 49th St
- 30-69 Hobart St Unit 2
- 55-23 31st Ave Unit 4H
- 30-68 50th St
- 56-05 31st Ave Unit 2O
- 56-05 31st Ave Unit I5C