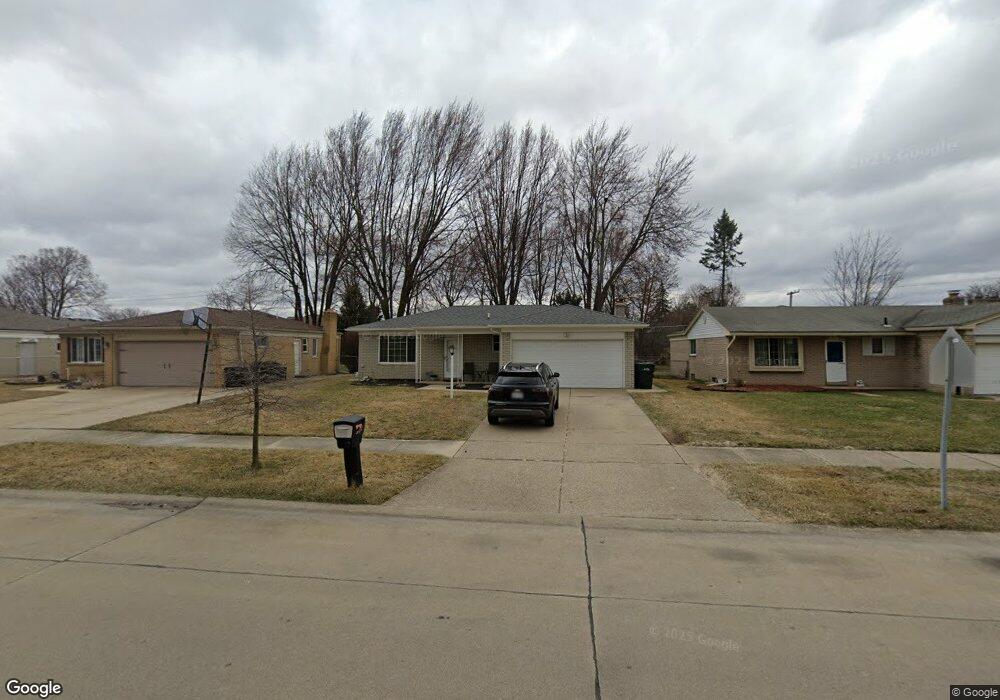
2849 Franklin Park Dr Sterling Heights, MI 48310
Estimated Value: $344,866 - $376,000
--
Bed
2
Baths
1,448
Sq Ft
$249/Sq Ft
Est. Value
About This Home
This home is located at 2849 Franklin Park Dr, Sterling Heights, MI 48310 and is currently estimated at $359,967, approximately $248 per square foot. 2849 Franklin Park Dr is a home located in Macomb County with nearby schools including Schuchard Elementary School, Frank Jeannette Junior High School, and Adlai Stevenson High School.
Ownership History
Date
Name
Owned For
Owner Type
Purchase Details
Closed on
May 23, 2016
Sold by
Al Kasmikha Samira and Kasmikha Hilda
Bought by
Kasmikha Frank M and Kasmikha Hilda
Current Estimated Value
Home Financials for this Owner
Home Financials are based on the most recent Mortgage that was taken out on this home.
Original Mortgage
$167,887
Outstanding Balance
$135,616
Interest Rate
4.12%
Mortgage Type
FHA
Estimated Equity
$224,351
Purchase Details
Closed on
Feb 17, 2011
Sold by
Al Kasmika Samira
Bought by
Al Kasmika Samira and Kasmikha Hilda
Purchase Details
Closed on
May 18, 2007
Sold by
Patel Hasmukh B and Patel Swamipyari H
Bought by
Al Kasmikha Samira
Purchase Details
Closed on
Dec 29, 2005
Sold by
Patel Sandeep M
Bought by
Patel Hasmukh B and Patel Swamipyari H
Purchase Details
Closed on
Aug 7, 2003
Sold by
Patel Hasmukhbhai B and Patel Geeta H
Bought by
Patel Hasmukhbhai B and Patel Geeta H
Create a Home Valuation Report for This Property
The Home Valuation Report is an in-depth analysis detailing your home's value as well as a comparison with similar homes in the area
Home Values in the Area
Average Home Value in this Area
Purchase History
| Date | Buyer | Sale Price | Title Company |
|---|---|---|---|
| Kasmikha Frank M | $173,685 | Madison Settlement Services | |
| Al Kasmika Samira | -- | None Available | |
| Al Kasmikha Samira | $170,000 | The Executive Advantage Titl | |
| Patel Hasmukh B | -- | Chicago Title Insurance Co | |
| Patel Hasmukhbhai B | -- | -- |
Source: Public Records
Mortgage History
| Date | Status | Borrower | Loan Amount |
|---|---|---|---|
| Open | Kasmikha Frank M | $167,887 |
Source: Public Records
Tax History Compared to Growth
Tax History
| Year | Tax Paid | Tax Assessment Tax Assessment Total Assessment is a certain percentage of the fair market value that is determined by local assessors to be the total taxable value of land and additions on the property. | Land | Improvement |
|---|---|---|---|---|
| 2025 | $3,103 | $153,400 | $0 | $0 |
| 2024 | $2,837 | $144,000 | $0 | $0 |
| 2023 | $2,678 | $130,000 | $0 | $0 |
| 2022 | $2,792 | $118,700 | $0 | $0 |
| 2021 | $2,734 | $113,600 | $0 | $0 |
| 2020 | $2,439 | $107,400 | $0 | $0 |
| 2019 | $2,499 | $102,700 | $0 | $0 |
| 2018 | $2,850 | $89,500 | $0 | $0 |
| 2017 | $3,610 | $85,000 | $14,800 | $70,200 |
| 2016 | $2,470 | $85,000 | $0 | $0 |
| 2015 | -- | $76,900 | $0 | $0 |
| 2014 | -- | $63,500 | $0 | $0 |
Source: Public Records
Map
Nearby Homes
- 2233 Mellowood Dr
- 39588 Dequindre Rd
- 39560 Dequindre Rd
- 3514 Bates Dr
- 2503 Westmont Cir
- 39198 Faith Dr
- 3777 Hamlet Dr
- 3600 Brandi Dr
- 3550 Kirkton Dr
- 2833 Bywater Dr
- 2700 Renshaw Dr
- 2336 Heritage Pointe Dr Unit 17
- 40444 Harmon Dr
- 3816 Pokley Ct
- 3038 Donna Dr
- 41466 Dequindre Rd
- 5238 Windmill Dr
- 41599 Red Oak Dr
- 3715 Knightbridge Cir
- 2452 Jonathan Dr
- 2861 Franklin Park Dr
- 2837 Franklin Park Dr
- 2825 Franklin Park Dr
- 2875 Franklin Park Dr
- 2656 Tiverton Dr
- 2813 Franklin Park Dr
- 40005 Gulliver Dr
- 2642 Tiverton Dr
- 2801 Franklin
- 40124 Harcourt Dr
- 2801 Franklin Park Dr Unit Bldg-Unit
- 2801 Franklin Park Dr
- 39870 Pinebrook Dr
- 2628 Tiverton Dr
- 3019 Franklin Park Dr
- 40019 Gulliver Dr
- 2663 Franklin Park Dr
- 40138 Harcourt Dr
- 39856 Pinebrook Dr
- 3008 Franklin Park Dr