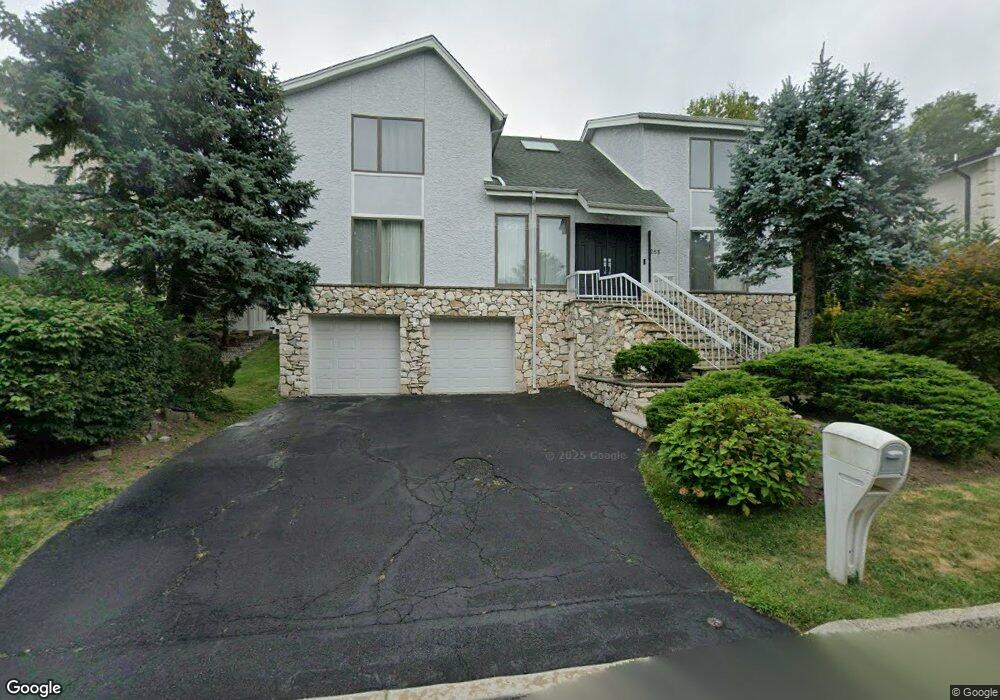
285 Arthur Ave Englewood Cliffs, NJ 07632
Estimated Value: $1,537,371 - $1,777,000
Studio
--
Bath
3,296
Sq Ft
$500/Sq Ft
Est. Value
About This Home
This home is located at 285 Arthur Ave, Englewood Cliffs, NJ 07632 and is currently estimated at $1,647,343, approximately $499 per square foot. 285 Arthur Ave is a home located in Bergen County with nearby schools including North Cliff Elementary School, Upper School Elementary School, and The Moriah School.
Ownership History
Date
Name
Owned For
Owner Type
Purchase Details
Closed on
Mar 2, 2022
Sold by
Kim Robert L
Bought by
Kim David Young
Current Estimated Value
Purchase Details
Closed on
May 24, 2007
Sold by
Toko Hitoshi and Toko Mieko
Bought by
Kim Robert L and Kim Christine S
Home Financials for this Owner
Home Financials are based on the most recent Mortgage that was taken out on this home.
Original Mortgage
$165,000
Interest Rate
6.17%
Mortgage Type
New Conventional
Purchase Details
Closed on
Nov 12, 1996
Sold by
Shinya Hiromi
Bought by
Toko Hitoshi and Toko Meiko
Home Financials for this Owner
Home Financials are based on the most recent Mortgage that was taken out on this home.
Original Mortgage
$90,000
Interest Rate
7.99%
Create a Home Valuation Report for This Property
The Home Valuation Report is an in-depth analysis detailing your home's value as well as a comparison with similar homes in the area
Home Values in the Area
Average Home Value in this Area
Purchase History
| Date | Buyer | Sale Price | Title Company |
|---|---|---|---|
| Kim David Young | -- | Cha Joseph J | |
| Kim David Young | -- | None Listed On Document | |
| Kim Robert L | $1,160,000 | -- | |
| Toko Hitoshi | $400,000 | -- |
Source: Public Records
Mortgage History
| Date | Status | Borrower | Loan Amount |
|---|---|---|---|
| Previous Owner | Kim Robert L | $165,000 | |
| Previous Owner | Toko Hitoshi | $90,000 |
Source: Public Records
Tax History
| Year | Tax Paid | Tax Assessment Tax Assessment Total Assessment is a certain percentage of the fair market value that is determined by local assessors to be the total taxable value of land and additions on the property. | Land | Improvement |
|---|---|---|---|---|
| 2025 | $13,145 | $1,138,100 | $585,000 | $553,100 |
| 2024 | $12,947 | $1,138,100 | $585,000 | $553,100 |
| 2023 | $12,743 | $1,134,700 | $585,000 | $549,700 |
| 2022 | $12,743 | $1,134,700 | $585,000 | $549,700 |
| 2021 | $12,754 | $1,134,700 | $585,000 | $549,700 |
| 2020 | $13,060 | $1,134,700 | $585,000 | $549,700 |
| 2019 | $12,266 | $1,134,700 | $585,000 | $549,700 |
| 2018 | $11,835 | $1,134,700 | $585,000 | $549,700 |
| 2017 | $11,324 | $1,134,700 | $585,000 | $549,700 |
| 2016 | $11,109 | $1,134,700 | $585,000 | $549,700 |
| 2015 | $10,553 | $1,134,700 | $585,000 | $549,700 |
| 2014 | $9,872 | $1,134,700 | $585,000 | $549,700 |
Source: Public Records
Map
Nearby Homes
- 312 Bolz St
- 316 Bolz St
- 365 Forest Dr
- 54 Van Nostrand Ave
- 10 E Bayview Ave
- 2455 3rd St
- 2446 3rd St
- 2449 Camner St
- 505 Adele Ct
- 2481 8th St
- 230B Washington Ave
- 2447 Camner St
- 220B Washington Ave Unit 220B
- 2400 Hudson Terrace Unit 3F
- 2410 3rd St
- 55 Hidden Ledge Rd
- 2430 8th St Unit 5B
- 485 Westview Place
- 470 Myrtle Ave
- 1 Wall St Unit 1E
Your Personal Tour Guide
Ask me questions while you tour the home.