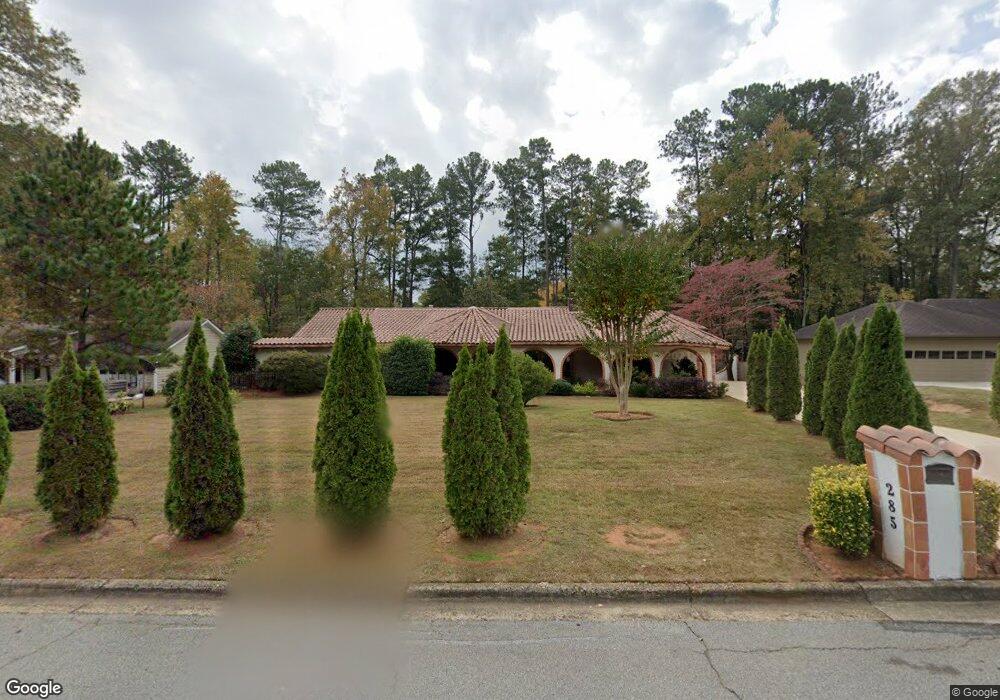
285 Bent Grass Dr Unit 2 Roswell, GA 30076
Estimated Value: $564,000 - $676,000
3
Beds
3
Baths
2,392
Sq Ft
$259/Sq Ft
Est. Value
About This Home
This home is located at 285 Bent Grass Dr Unit 2, Roswell, GA 30076 and is currently estimated at $619,028, approximately $258 per square foot. 285 Bent Grass Dr Unit 2 is a home located in Fulton County with nearby schools including Vickery Mill Elementary, Elkins Pointe Middle School, and Fulton Academy of Science and Technology.
Ownership History
Date
Name
Owned For
Owner Type
Purchase Details
Closed on
Oct 20, 2011
Sold by
Sivan Yariv
Bought by
Sivan Nadav and Kahn Rena Ann
Current Estimated Value
Purchase Details
Closed on
Apr 29, 2011
Sold by
Us Bank Na Series 2006 & 3
Bought by
Sivan Yariv
Home Financials for this Owner
Home Financials are based on the most recent Mortgage that was taken out on this home.
Original Mortgage
$100,000
Interest Rate
4.81%
Mortgage Type
New Conventional
Purchase Details
Closed on
Jan 4, 2011
Sold by
Apple Craig S
Bought by
Us Bank Na Series 2006 & 3
Purchase Details
Closed on
Jul 22, 2010
Sold by
285 Bent Grass Trust
Bought by
Apple Craig S
Purchase Details
Closed on
Mar 31, 2006
Sold by
Apple Craig S
Bought by
285 Bent Grass Trust
Create a Home Valuation Report for This Property
The Home Valuation Report is an in-depth analysis detailing your home's value as well as a comparison with similar homes in the area
Home Values in the Area
Average Home Value in this Area
Purchase History
| Date | Buyer | Sale Price | Title Company |
|---|---|---|---|
| Sivan Nadav | -- | -- | |
| Sivan Yariv | $185,000 | -- | |
| Us Bank Na Series 2006 & 3 | $153,000 | -- | |
| Apple Craig S | -- | -- | |
| 285 Bent Grass Trust | -- | -- |
Source: Public Records
Mortgage History
| Date | Status | Borrower | Loan Amount |
|---|---|---|---|
| Previous Owner | Sivan Yariv | $100,000 |
Source: Public Records
Tax History Compared to Growth
Tax History
| Year | Tax Paid | Tax Assessment Tax Assessment Total Assessment is a certain percentage of the fair market value that is determined by local assessors to be the total taxable value of land and additions on the property. | Land | Improvement |
|---|---|---|---|---|
| 2025 | $498 | $177,440 | $60,080 | $117,360 |
| 2023 | $5,103 | $180,800 | $32,760 | $148,040 |
| 2022 | $1,650 | $140,720 | $33,160 | $107,560 |
| 2021 | $356 | $130,320 | $28,400 | $101,920 |
| 2020 | $2,008 | $124,040 | $27,040 | $97,000 |
| 2019 | $373 | $136,040 | $25,960 | $110,080 |
| 2018 | $2,606 | $119,720 | $34,960 | $84,760 |
| 2017 | $1,723 | $71,000 | $15,640 | $55,360 |
| 2016 | $1,722 | $71,000 | $15,640 | $55,360 |
| 2015 | $2,102 | $71,000 | $15,640 | $55,360 |
| 2014 | $1,779 | $71,000 | $15,640 | $55,360 |
Source: Public Records
Map
Nearby Homes
- 275 Bent Grass Dr
- 295 Bent Grass Dr Unit 2
- 270 Putting Green Ln
- 280 Putting Green Ln
- 265 Bent Grass Dr
- 280 Bent Grass Dr
- 270 Bent Grass Dr
- 290 Bent Grass Dr
- 315 Bent Grass Dr Unit 2
- 250 Putting Green Ln
- 290 Putting Green Ln
- 260 Bent Grass Dr
- 300 Bent Grass Dr Unit 2
- 255 Bent Grass Dr
- 0 Putting Green Ln Unit 7406492
- 0 Putting Green Ln Unit 8477812
- 0 Putting Green Ln Unit 8167336
- 240 Putting Green Ln
- 300 Putting Green Ln
- 250 Bent Grass Dr