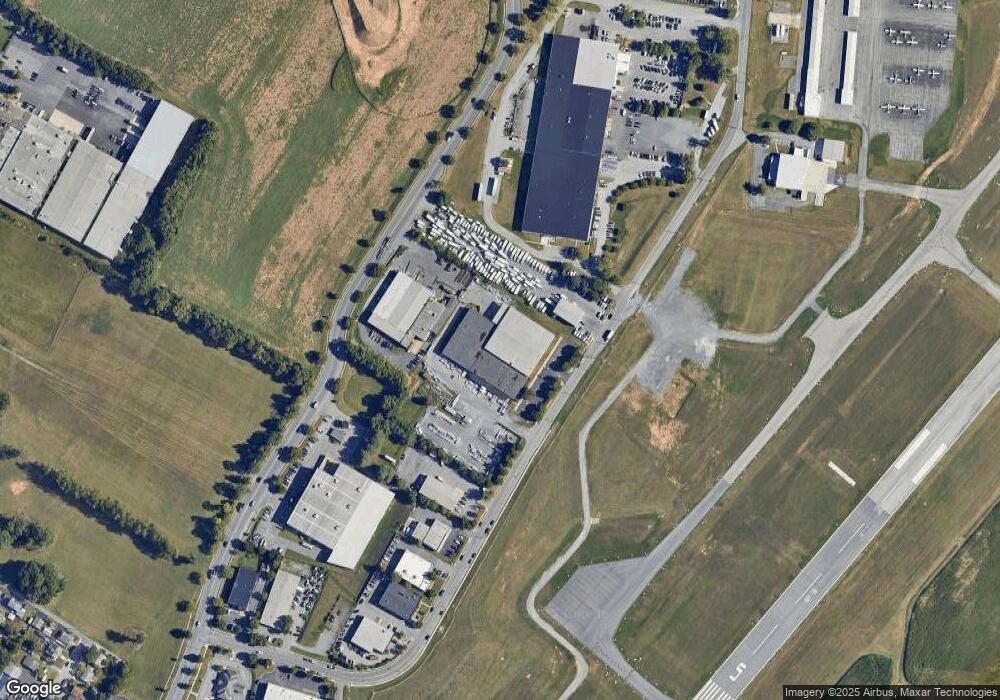
285 Bucheimer Rd Frederick, MD 21701
East Frederick Neighborhood
Studio
--
Bath
54,138
Sq Ft
116,741
Sq Ft Lot
About This Home
This home is located at 285 Bucheimer Rd, Frederick, MD 21701. 285 Bucheimer Rd is a home located in Frederick County with nearby schools including Spring Ridge Elementary School, Gov. Thomas Johnson Middle School, and Gov. Thomas Johnson High School.
Ownership History
Date
Name
Owned For
Owner Type
Purchase Details
Closed on
Sep 11, 2019
Sold by
Remsberg Llc
Bought by
285 Bucheimer Llc
Home Financials for this Owner
Home Financials are based on the most recent Mortgage that was taken out on this home.
Original Mortgage
$500,000
Outstanding Balance
$437,961
Interest Rate
3.6%
Mortgage Type
Purchase Money Mortgage
Purchase Details
Closed on
May 1, 1997
Sold by
Remsberg Properties Inc
Bought by
Remsberg Land Holdings Inc
Purchase Details
Closed on
Apr 21, 1997
Sold by
Remsberg Llc
Bought by
Remsberg Properties Inc
Purchase Details
Closed on
Apr 18, 1997
Sold by
Remsburg Tent Rentals Inc
Bought by
Remsberg Properties Inc
Purchase Details
Closed on
Dec 30, 1993
Sold by
Fred Cnty Natl Bk
Bought by
Rentls Remsberg Tent
Home Financials for this Owner
Home Financials are based on the most recent Mortgage that was taken out on this home.
Original Mortgage
$400,000
Interest Rate
7%
Mortgage Type
Commercial
Create a Home Valuation Report for This Property
The Home Valuation Report is an in-depth analysis detailing your home's value as well as a comparison with similar homes in the area
Home Values in the Area
Average Home Value in this Area
Purchase History
| Date | Buyer | Sale Price | Title Company |
|---|---|---|---|
| 285 Bucheimer Llc | $3,190,000 | Micasa Title Group Llc | |
| Remsberg Land Holdings Inc | -- | -- | |
| Remsberg Properties Inc | -- | -- | |
| Remsberg Properties Inc | -- | -- | |
| Rentls Remsberg Tent | $775,000 | -- |
Source: Public Records
Mortgage History
| Date | Status | Borrower | Loan Amount |
|---|---|---|---|
| Open | 285 Bucheimer Llc | $500,000 | |
| Previous Owner | Rentls Remsberg Tent | $400,000 | |
| Closed | Rentls Remsberg Tent | $320,000 |
Source: Public Records
Tax History
| Year | Tax Paid | Tax Assessment Tax Assessment Total Assessment is a certain percentage of the fair market value that is determined by local assessors to be the total taxable value of land and additions on the property. | Land | Improvement |
|---|---|---|---|---|
| 2025 | $46,252 | $2,339,400 | $758,800 | $1,580,600 |
| 2024 | $46,252 | $2,339,400 | $758,800 | $1,580,600 |
| 2023 | $45,036 | $2,339,400 | $758,800 | $1,580,600 |
| 2022 | $45,625 | $2,381,100 | $758,800 | $1,622,300 |
| 2021 | $43,221 | $2,292,233 | $0 | $0 |
| 2020 | $42,352 | $2,203,367 | $0 | $0 |
| 2019 | $40,761 | $2,114,500 | $758,800 | $1,355,700 |
| 2018 | $37,718 | $2,114,500 | $758,800 | $1,355,700 |
| 2017 | $42,018 | $2,114,500 | $0 | $0 |
| 2016 | $40,732 | $2,191,600 | $0 | $0 |
| 2015 | $40,732 | $2,149,533 | $0 | $0 |
| 2014 | $40,732 | $2,107,367 | $0 | $0 |
Source: Public Records
Map
Nearby Homes
- 391 Ensemble Way
- 411 Ensemble Way
- 413 Ensemble Way
- 417 Ensemble Way
- 415 Ensemble Way
- 719 Compass Way
- 442 Ensemble Way
- 726 Compass Way
- 725 Compass Way
- 443 Ensemble Way
- 445 Ensemble Way
- 455 Ensemble Way
- 457 Ensemble Way
- 459 Ensemble Way
- 459 Hanson St
- 715 Courier Ln
- 457 Tiller St
- 270 Ensemble Way
- 485 Hanson St
- 477 Tiller St
- 291 Bucheimer Rd
- 530 Monocacy Blvd
- 229 Bucheimer Rd
- 225 Bucheimer Rd
- 295 Bucheimer Rd Unit C
- 500 Monocacy Blvd
- 1319 Bucheimer Rd
- 1317 Bucheimer Rd
- 0 Monocacy Blvd Unit FR7437567
- 1313 Bucheimer Rd
- 205 Bucheimer Rd
- 295 Bailes Ln Unit C
- 296 Bucheimer Rd
- 201 Bucheimer Rd
- 299 Bucheimer Rd Unit 7
- 299 Bucheimer Rd Unit 5
- 299 Bucheimer Rd Unit 6
- 299 Bucheimer Rd Unit 4
- 299 Bucheimer Rd Unit 2
- 299 Bucheimer Rd Unit 1
Your Personal Tour Guide
Ask me questions while you tour the home.