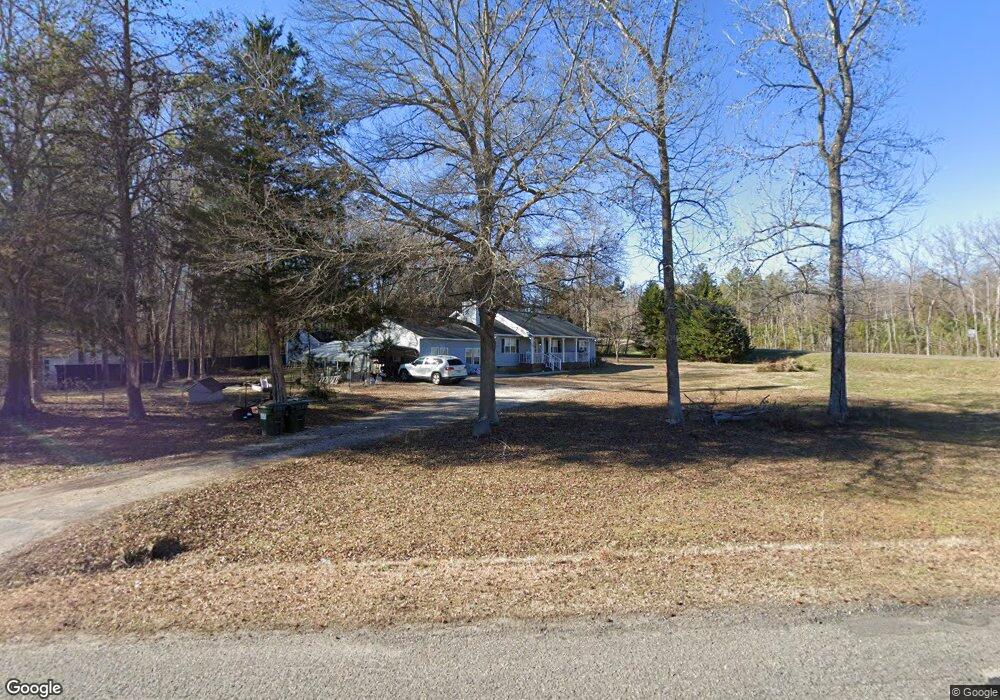
285 Cross Rd Clover, SC 29710
Estimated Value: $317,181 - $346,000
3
Beds
2
Baths
1,495
Sq Ft
$223/Sq Ft
Est. Value
About This Home
This home is located at 285 Cross Rd, Clover, SC 29710 and is currently estimated at $333,545, approximately $223 per square foot. 285 Cross Rd is a home located in York County with nearby schools including Griggs Road Elementary School, Clover Middle School, and Clover High School.
Ownership History
Date
Name
Owned For
Owner Type
Purchase Details
Closed on
Jan 28, 2022
Sold by
Joseph Schleck
Bought by
Eskay Nicole and Eskay Robert
Current Estimated Value
Home Financials for this Owner
Home Financials are based on the most recent Mortgage that was taken out on this home.
Original Mortgage
$233,750
Outstanding Balance
$215,950
Interest Rate
3.45%
Mortgage Type
New Conventional
Estimated Equity
$117,596
Purchase Details
Closed on
Dec 9, 2013
Sold by
Kohler Thomas A and Kohler Marie A
Bought by
Schleck Joseph and Schleck Leslie J
Purchase Details
Closed on
Feb 14, 2007
Sold by
Pettus William David
Bought by
Kohler Thomas A and Kohler Marie A
Home Financials for this Owner
Home Financials are based on the most recent Mortgage that was taken out on this home.
Original Mortgage
$140,000
Interest Rate
6.16%
Mortgage Type
New Conventional
Create a Home Valuation Report for This Property
The Home Valuation Report is an in-depth analysis detailing your home's value as well as a comparison with similar homes in the area
Home Values in the Area
Average Home Value in this Area
Purchase History
| Date | Buyer | Sale Price | Title Company |
|---|---|---|---|
| Eskay Nicole | $275,000 | Cook And James Llc | |
| Schleck Joseph | $169,900 | -- | |
| Kohler Thomas A | $140,000 | None Available |
Source: Public Records
Mortgage History
| Date | Status | Borrower | Loan Amount |
|---|---|---|---|
| Open | Eskay Nicole | $233,750 | |
| Previous Owner | Kohler Thomas A | $140,000 |
Source: Public Records
Tax History
| Year | Tax Paid | Tax Assessment Tax Assessment Total Assessment is a certain percentage of the fair market value that is determined by local assessors to be the total taxable value of land and additions on the property. | Land | Improvement |
|---|---|---|---|---|
| 2025 | $1,390 | $10,644 | $1,800 | $8,844 |
| 2024 | $1,377 | $10,316 | $1,520 | $8,796 |
| 2023 | $5,905 | $15,474 | $2,280 | $13,194 |
| 2022 | $369 | $5,336 | $1,392 | $3,944 |
| 2021 | -- | $5,336 | $1,392 | $3,944 |
| 2020 | $361 | $5,336 | $0 | $0 |
| 2019 | $550 | $4,640 | $0 | $0 |
| 2018 | $555 | $4,640 | $0 | $0 |
| 2017 | $516 | $4,640 | $0 | $0 |
| 2016 | $505 | $4,640 | $0 | $0 |
| 2014 | $595 | $6,900 | $1,920 | $4,980 |
| 2013 | $595 | $7,830 | $1,920 | $5,910 |
Source: Public Records
Map
Nearby Homes
- 10.64 AC Burree Rd Unit 6
- 10.64 AC Burree Rd
- 221 Burree Rd
- 9 AC Burree Rd
- 109 Highland Forest Dr
- Lot 24 Mute Swan Haven Ln
- Lot 17 Great Blue Path
- 425 Snow Goose Walk None
- Lot 36 Snow Goose Walk Ct
- Lot 37 Snow Goose Walk Ct
- 636 American Bittern Way
- Lot 15 American Bittern Path
- Lot 35 Snow Goose Walk Ct
- Lot 14 American Bittern Path
- Lot 11 American Bittern Path
- Lot 13 American Bittern Path
- Lot 1 Great Blue Path
- 790 Brandon Rd
- 398 Kingsburry Rd
- 537 Riddle Mill Rd
Your Personal Tour Guide
Ask me questions while you tour the home.