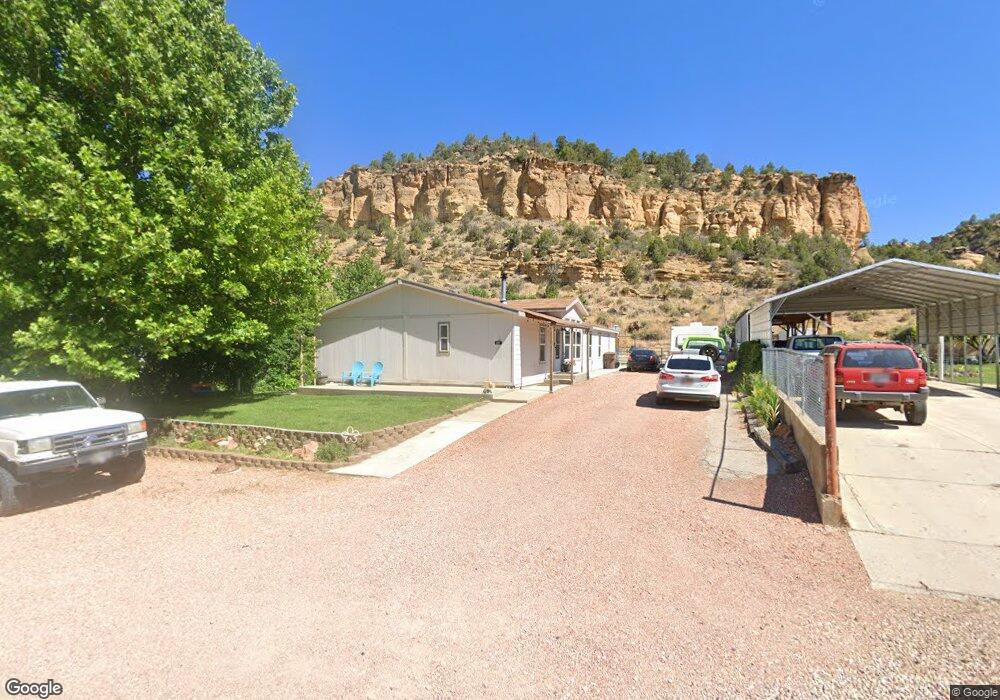
285 E 100 St N Orderville, UT 84758
Estimated Value: $237,971 - $1,230,000
2
Beds
1
Bath
1,263
Sq Ft
$445/Sq Ft
Est. Value
About This Home
This home is located at 285 E 100 St N, Orderville, UT 84758 and is currently estimated at $561,743, approximately $444 per square foot. 285 E 100 St N is a home located in Kane County with nearby schools including Valley Elementary School and Valley High School.
Ownership History
Date
Name
Owned For
Owner Type
Purchase Details
Closed on
Dec 2, 2005
Sold by
Crofts Kent L
Bought by
Crofts Kent
Current Estimated Value
Home Financials for this Owner
Home Financials are based on the most recent Mortgage that was taken out on this home.
Original Mortgage
$113,713
Outstanding Balance
$62,789
Interest Rate
6.07%
Estimated Equity
$498,954
Create a Home Valuation Report for This Property
The Home Valuation Report is an in-depth analysis detailing your home's value as well as a comparison with similar homes in the area
Purchase History
| Date | Buyer | Sale Price | Title Company |
|---|---|---|---|
| Crofts Kent | -- | -- |
Source: Public Records
Mortgage History
| Date | Status | Borrower | Loan Amount |
|---|---|---|---|
| Open | Crofts Kent | $113,713 |
Source: Public Records
Tax History
| Year | Tax Paid | Tax Assessment Tax Assessment Total Assessment is a certain percentage of the fair market value that is determined by local assessors to be the total taxable value of land and additions on the property. | Land | Improvement |
|---|---|---|---|---|
| 2025 | $998 | $218,335 | $42,776 | $175,559 |
| 2024 | $989 | $117,973 | $22,406 | $95,567 |
| 2023 | $871 | $108,218 | $21,339 | $86,879 |
| 2022 | $1,016 | $111,332 | $22,308 | $89,024 |
| 2021 | $958 | $155,709 | $31,200 | $124,509 |
| 2020 | $984 | $155,709 | $31,200 | $124,509 |
| 2019 | $883 | $135,524 | $31,200 | $104,324 |
| 2018 | $889 | $135,524 | $31,200 | $104,324 |
| 2017 | $929 | $138,970 | $31,200 | $107,770 |
| 2016 | $952 | $138,970 | $31,200 | $107,770 |
| 2015 | $889 | $138,970 | $31,200 | $107,770 |
| 2014 | $889 | $128,707 | $31,200 | $97,507 |
| 2013 | -- | $70,789 | $0 | $0 |
Source: Public Records
Map
Nearby Homes
- 421 White Sands Way Unit D
- 421 White Sands Way Unit B
- 0 W White Cliffs Dr Unit 1409195
- 23 W White Cliffs Dr Unit 23
- 10915 S Pinyon Pine Dr
- 1045 S Pinyon Pine Dr
- 618 W Cedar Dr
- 95 E 100 N
- 0 Bench Rd
- 325 N Main St
- 0 Hwy 89 Unit 1408986
- 1 Caruso Ln Unit 1
- 35 Prickley Pear Pinyon Pine Dr Unit 35
- 6 Caruso Ln Unit 6
- 12 Block "C" St Unit 8A-C12
- 12 Mountain View Dr Unit 12
- 5 Caruso Ln Unit 5
- 2 Caruso Ln Unit 2
- 3 Caruso Ln Unit 1
- 9 St
- 271 E 100 St N
- 299 E 100 St N
- 251 E 100 St N
- 274 E 100 St N
- 325 E 100 St N
- 290 E 100 St N
- 260 E 100 St N
- 231 E 100 St N
- 236 E 100 St N
- 353 E 100 North St N
- 211 E 100 St N
- 210 E 100 St N
- 371 E 100 St N
- 385 E 100 St N
- 185 E 100 St N
- 190 E 100 North St N
- 299 E State St
- 311 E State St
- 45 N 250 E
- 321 E State St
Your Personal Tour Guide
Ask me questions while you tour the home.