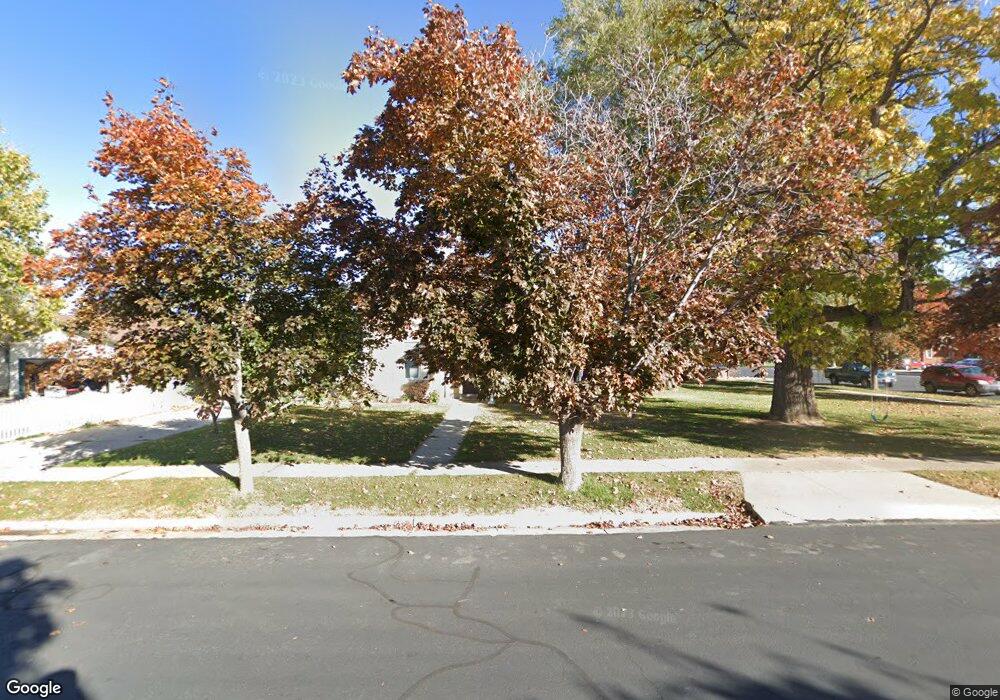
285 E 200 N Spanish Fork, UT 84660
Estimated Value: $445,000 - $468,000
4
Beds
2
Baths
1,988
Sq Ft
$229/Sq Ft
Est. Value
About This Home
This home is located at 285 E 200 N, Spanish Fork, UT 84660 and is currently estimated at $455,664, approximately $229 per square foot. 285 E 200 N is a home located in Utah County with nearby schools including Park Elementary School, Spanish Fork Jr High School, and Spanish Fork High School.
Ownership History
Date
Name
Owned For
Owner Type
Purchase Details
Closed on
Jun 21, 2010
Sold by
Garzand Thomas and Garzand Alecia
Bought by
Garzand Thomas and Garzand Alecia
Current Estimated Value
Home Financials for this Owner
Home Financials are based on the most recent Mortgage that was taken out on this home.
Original Mortgage
$171,000
Outstanding Balance
$114,267
Interest Rate
4.91%
Mortgage Type
New Conventional
Estimated Equity
$341,397
Purchase Details
Closed on
Oct 10, 2007
Sold by
Newren L Scott and Newren Anne
Bought by
Garzand Thomas and Garzand Alecia
Home Financials for this Owner
Home Financials are based on the most recent Mortgage that was taken out on this home.
Original Mortgage
$21,200
Interest Rate
6.27%
Mortgage Type
Stand Alone Second
Create a Home Valuation Report for This Property
The Home Valuation Report is an in-depth analysis detailing your home's value as well as a comparison with similar homes in the area
Home Values in the Area
Average Home Value in this Area
Purchase History
| Date | Buyer | Sale Price | Title Company |
|---|---|---|---|
| Garzand Thomas | -- | Bartlett Title Insurance Ag | |
| Garzand Thomas | -- | Bartlett Title Insurance Ag |
Source: Public Records
Mortgage History
| Date | Status | Borrower | Loan Amount |
|---|---|---|---|
| Open | Garzand Thomas | $171,000 | |
| Closed | Garzand Thomas | $21,200 | |
| Closed | Garzand Thomas | $170,000 |
Source: Public Records
Tax History
| Year | Tax Paid | Tax Assessment Tax Assessment Total Assessment is a certain percentage of the fair market value that is determined by local assessors to be the total taxable value of land and additions on the property. | Land | Improvement |
|---|---|---|---|---|
| 2025 | $1,901 | $215,050 | -- | -- |
| 2024 | $1,901 | $195,910 | $0 | $0 |
| 2023 | $1,902 | $196,295 | $0 | $0 |
| 2022 | $1,987 | $201,080 | $0 | $0 |
| 2021 | $1,695 | $274,400 | $92,800 | $181,600 |
| 2020 | $1,530 | $240,900 | $77,300 | $163,600 |
| 2019 | $1,347 | $223,000 | $77,300 | $145,700 |
| 2018 | $1,274 | $204,000 | $77,300 | $126,700 |
| 2017 | $1,220 | $104,940 | $0 | $0 |
| 2016 | $1,004 | $85,250 | $0 | $0 |
| 2015 | $1,012 | $84,865 | $0 | $0 |
| 2014 | $1,023 | $86,130 | $0 | $0 |
Source: Public Records
Map
Nearby Homes
Your Personal Tour Guide
Ask me questions while you tour the home.