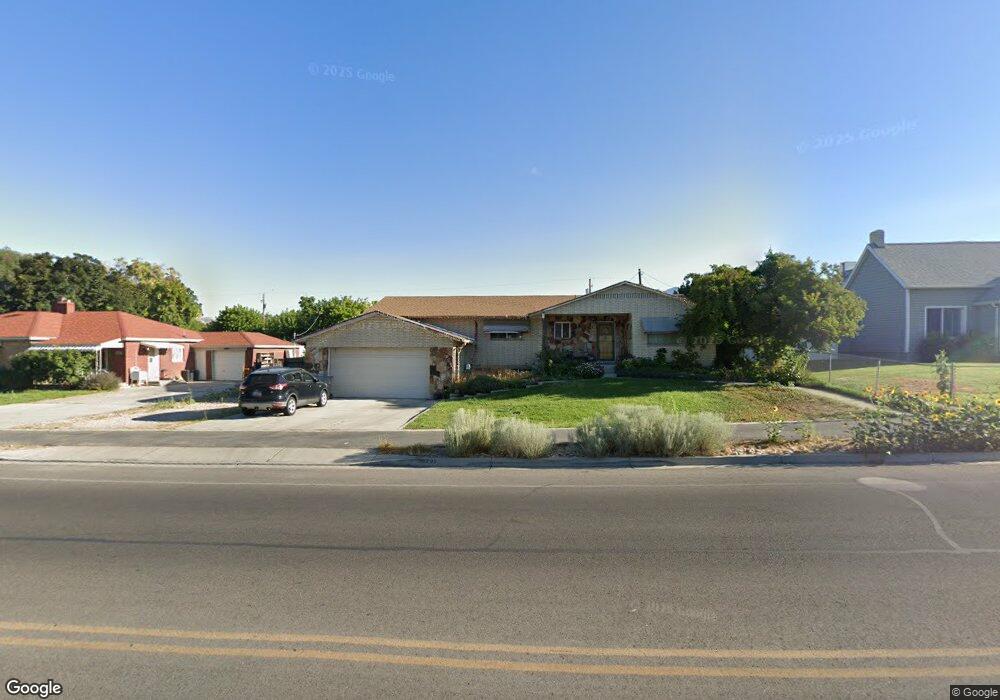
285 E 300 N American Fork, UT 84003
Estimated Value: $530,000 - $632,322
3
Beds
2
Baths
3,180
Sq Ft
$185/Sq Ft
Est. Value
About This Home
This home is located at 285 E 300 N, American Fork, UT 84003 and is currently estimated at $589,331, approximately $185 per square foot. 285 E 300 N is a home located in Utah County with nearby schools including Forbes Elementary School, American Fork Junior High School, and American Fork High School.
Ownership History
Date
Name
Owned For
Owner Type
Purchase Details
Closed on
Nov 18, 2024
Sold by
Kleinman Nilvia A and Kleiman Harold Rey
Bought by
Cpc Development
Current Estimated Value
Purchase Details
Closed on
Feb 22, 2023
Sold by
Miller Elizabeth C
Bought by
Elizabeth Miller Family Revocable Trust
Purchase Details
Closed on
Jan 19, 1999
Sold by
Miller Lowell Scott
Bought by
Miller Lowell Scott and Miller Elizabeth C
Home Financials for this Owner
Home Financials are based on the most recent Mortgage that was taken out on this home.
Original Mortgage
$155,900
Interest Rate
6.63%
Create a Home Valuation Report for This Property
The Home Valuation Report is an in-depth analysis detailing your home's value as well as a comparison with similar homes in the area
Home Values in the Area
Average Home Value in this Area
Purchase History
| Date | Buyer | Sale Price | Title Company |
|---|---|---|---|
| Cpc Development | -- | None Listed On Document | |
| Cpc Development | -- | None Listed On Document | |
| Elizabeth Miller Family Revocable Trust | -- | None Listed On Document | |
| Miller Lowell Scott | -- | Action Title Company | |
| Miller Lowell Scott | -- | Action Title Company |
Source: Public Records
Mortgage History
| Date | Status | Borrower | Loan Amount |
|---|---|---|---|
| Previous Owner | Miller Lowell Scott | $155,900 |
Source: Public Records
Tax History
| Year | Tax Paid | Tax Assessment Tax Assessment Total Assessment is a certain percentage of the fair market value that is determined by local assessors to be the total taxable value of land and additions on the property. | Land | Improvement |
|---|---|---|---|---|
| 2025 | $2,621 | $307,945 | -- | -- |
| 2024 | $2,621 | $291,225 | $0 | $0 |
| 2023 | $2,476 | $291,720 | $0 | $0 |
| 2022 | $2,551 | $296,560 | $0 | $0 |
| 2021 | $2,184 | $396,500 | $169,000 | $227,500 |
| 2020 | $2,042 | $359,600 | $150,900 | $208,700 |
| 2019 | $1,926 | $350,800 | $142,300 | $208,500 |
| 2018 | $1,816 | $316,200 | $129,300 | $186,900 |
| 2017 | $1,749 | $164,395 | $0 | $0 |
| 2016 | $1,767 | $154,275 | $0 | $0 |
| 2015 | $1,731 | $143,440 | $0 | $0 |
| 2014 | $1,566 | $127,985 | $0 | $0 |
Source: Public Records
Map
Nearby Homes
Your Personal Tour Guide
Ask me questions while you tour the home.