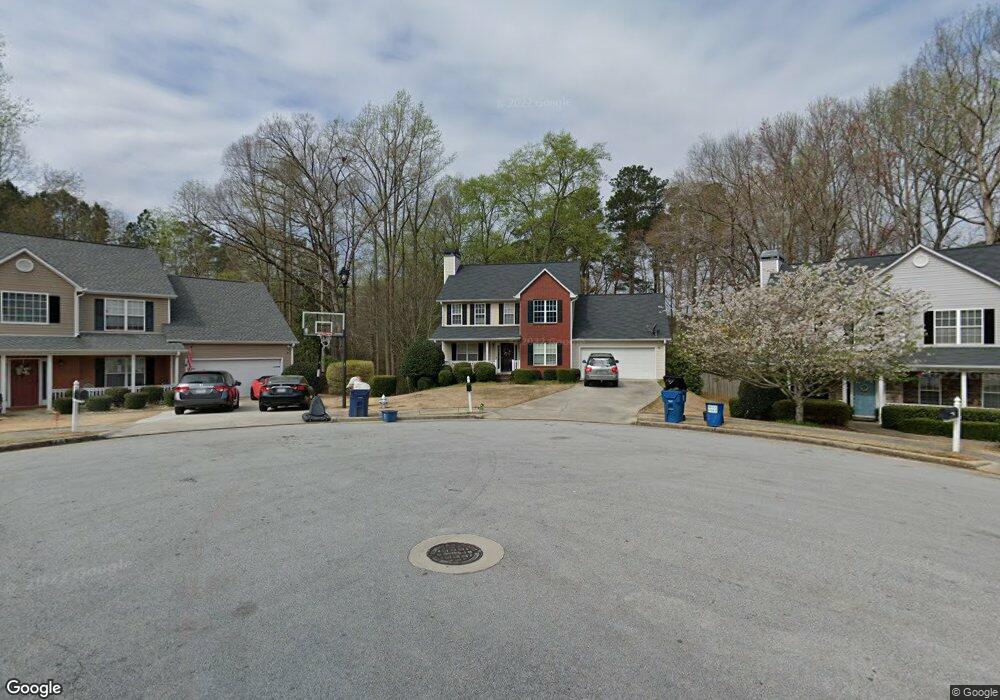
285 Grayson Manor Dr Unit 1 Loganville, GA 30052
Estimated Value: $381,000 - $398,974
3
Beds
3
Baths
1,694
Sq Ft
$230/Sq Ft
Est. Value
About This Home
This home is located at 285 Grayson Manor Dr Unit 1, Loganville, GA 30052 and is currently estimated at $388,994, approximately $229 per square foot. 285 Grayson Manor Dr Unit 1 is a home located in Gwinnett County with nearby schools including Trip Elementary School, Bay Creek Middle School, and Grayson High School.
Ownership History
Date
Name
Owned For
Owner Type
Purchase Details
Closed on
Nov 5, 2019
Sold by
Shuler Kenneth B
Bought by
Bailey Sylvia
Current Estimated Value
Home Financials for this Owner
Home Financials are based on the most recent Mortgage that was taken out on this home.
Original Mortgage
$218,975
Outstanding Balance
$190,893
Interest Rate
3.5%
Mortgage Type
New Conventional
Estimated Equity
$198,101
Purchase Details
Closed on
Jul 27, 2006
Sold by
Pendergraft Eric E and Pendergraft Mary A
Bought by
Shuler Kenneth B
Home Financials for this Owner
Home Financials are based on the most recent Mortgage that was taken out on this home.
Original Mortgage
$196,895
Interest Rate
6.68%
Mortgage Type
FHA
Purchase Details
Closed on
May 22, 2002
Sold by
Meridian Homes/Georgia Inc
Bought by
Pendergraft Eric E and Pendergraft Mary A
Home Financials for this Owner
Home Financials are based on the most recent Mortgage that was taken out on this home.
Original Mortgage
$147,584
Interest Rate
6.92%
Mortgage Type
FHA
Create a Home Valuation Report for This Property
The Home Valuation Report is an in-depth analysis detailing your home's value as well as a comparison with similar homes in the area
Home Values in the Area
Average Home Value in this Area
Purchase History
| Date | Buyer | Sale Price | Title Company |
|---|---|---|---|
| Bailey Sylvia | $230,500 | -- | |
| Shuler Kenneth B | $198,500 | -- | |
| Pendergraft Eric E | $149,900 | -- |
Source: Public Records
Mortgage History
| Date | Status | Borrower | Loan Amount |
|---|---|---|---|
| Open | Bailey Sylvia | $218,975 | |
| Previous Owner | Shuler Kenneth B | $196,895 | |
| Previous Owner | Pendergraft Eric E | $147,584 |
Source: Public Records
Tax History Compared to Growth
Tax History
| Year | Tax Paid | Tax Assessment Tax Assessment Total Assessment is a certain percentage of the fair market value that is determined by local assessors to be the total taxable value of land and additions on the property. | Land | Improvement |
|---|---|---|---|---|
| 2024 | $1,506 | $140,960 | $26,120 | $114,840 |
| 2023 | $1,506 | $145,880 | $30,000 | $115,880 |
| 2022 | $1,467 | $130,000 | $24,400 | $105,600 |
| 2021 | $3,384 | $91,520 | $18,000 | $73,520 |
| 2020 | $3,627 | $91,520 | $18,000 | $73,520 |
| 2019 | $2,666 | $85,000 | $16,000 | $69,000 |
| 2018 | $2,510 | $77,800 | $16,000 | $61,800 |
| 2016 | $2,215 | $63,200 | $12,480 | $50,720 |
| 2015 | $2,236 | $63,200 | $12,480 | $50,720 |
| 2014 | $2,151 | $58,840 | $11,200 | $47,640 |
Source: Public Records
Map
Nearby Homes
- 275 Grayson Manor Dr
- 3460 Watson Gate Rd
- 474 Cherry Creek Dr
- 3170 Sparrow Creek Dr
- 3313 Beech Hollow Ct
- 3360 Battlement Cir
- 3460 Garden Walk Ln
- 0 Highway 78 Unit 10376768
- 0 Highway 78 Unit 7454844
- 0 Highway 78 Unit 10133175
- 3625 Oak Grove Rd SW
- 2999 Battlement Cir
- 3218 Watson Woods Way
- 3548 Woodshade Dr
- 3385 Wellbrook Dr
- 370 Shadowbrooke Dr
- 321 Shadowbrooke Dr
- 239 Hope Hollow Rd
- 520 Aristocrat Dr
- 278 Jarrod Oaks Ct
- 285 Grayson Manor Dr SW
- E Grayson Manor Dr SW
- 295 Grayson Manor Dr
- 120 Lake Valley Dr
- 265 Grayson Manor Dr
- 280 Grayson Manor Dr
- 0 Grayson Manor Dr SW Unit 7309190
- 0 Grayson Manor Dr SW Unit 7292824
- 0 Grayson Manor Dr SW Unit 8259138
- 0 Grayson Manor Dr SW Unit 8221624
- 0 Grayson Manor Dr SW Unit 8018573
- 0 Grayson Manor Dr SW
- 270 Grayson Manor Dr SW
- 270 Grayson Manor Dr
- 260 Grayson Manor Dr Unit 1
- 121 Lake Valley Dr SW
- 121 Lake Valley Dr
- 150 Lake Valley Dr
- 250 Grayson Manor Dr
- 90 Lake Valley Dr