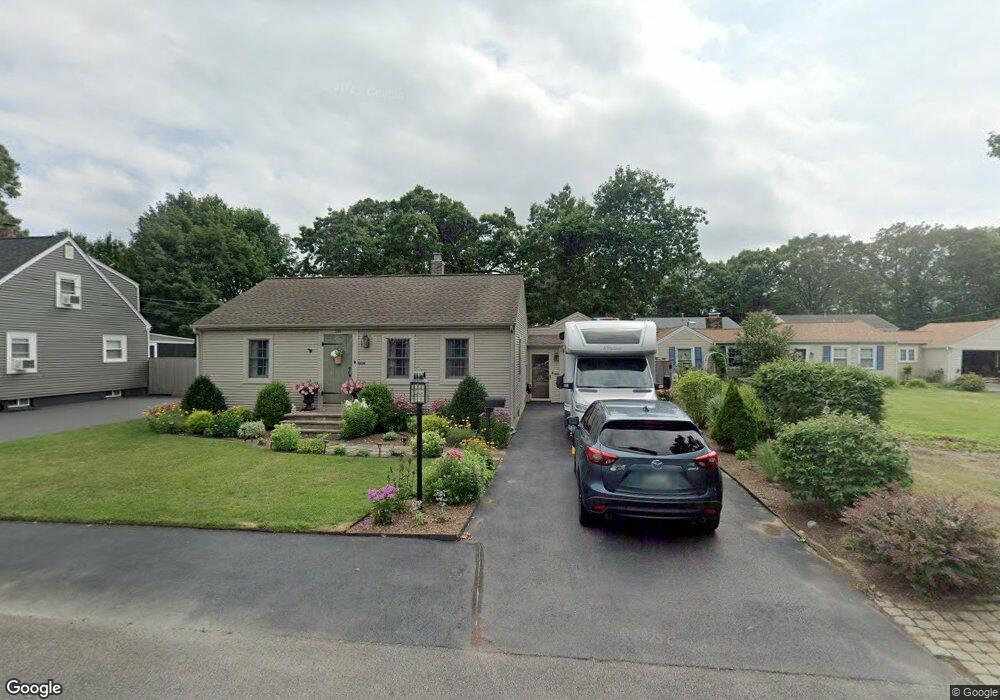
285 Maple St Warwick, RI 02888
Norwood NeighborhoodEstimated Value: $397,000 - $433,000
2
Beds
2
Baths
1,372
Sq Ft
$303/Sq Ft
Est. Value
About This Home
This home is located at 285 Maple St, Warwick, RI 02888 and is currently estimated at $415,212, approximately $302 per square foot. 285 Maple St is a home located in Kent County with nearby schools including Nel/Cps Construction Career, St. Peter School, and Saint Paul School.
Ownership History
Date
Name
Owned For
Owner Type
Purchase Details
Closed on
Dec 1, 2005
Sold by
Disley Royal M Est and Disley
Bought by
Disley Lynn M and Bodell Joan
Current Estimated Value
Home Financials for this Owner
Home Financials are based on the most recent Mortgage that was taken out on this home.
Original Mortgage
$190,000
Interest Rate
6.14%
Mortgage Type
Purchase Money Mortgage
Create a Home Valuation Report for This Property
The Home Valuation Report is an in-depth analysis detailing your home's value as well as a comparison with similar homes in the area
Home Values in the Area
Average Home Value in this Area
Purchase History
| Date | Buyer | Sale Price | Title Company |
|---|---|---|---|
| Disley Lynn M | $240,000 | -- |
Source: Public Records
Mortgage History
| Date | Status | Borrower | Loan Amount |
|---|---|---|---|
| Open | Disley Lynn M | $172,000 | |
| Closed | Disley Lynn M | $14,700 | |
| Closed | Disley Lynn M | $190,000 |
Source: Public Records
Tax History
| Year | Tax Paid | Tax Assessment Tax Assessment Total Assessment is a certain percentage of the fair market value that is determined by local assessors to be the total taxable value of land and additions on the property. | Land | Improvement |
|---|---|---|---|---|
| 2025 | $4,858 | $382,500 | $101,100 | $281,400 |
| 2024 | $4,439 | $306,800 | $87,900 | $218,900 |
| 2023 | $4,353 | $306,800 | $87,900 | $218,900 |
| 2022 | $4,094 | $218,600 | $56,900 | $161,700 |
| 2021 | $4,094 | $218,600 | $56,900 | $161,700 |
| 2020 | $4,094 | $218,600 | $56,900 | $161,700 |
| 2019 | $4,094 | $218,600 | $56,900 | $161,700 |
| 2018 | $3,509 | $168,700 | $56,900 | $111,800 |
| 2017 | $3,414 | $168,700 | $56,900 | $111,800 |
| 2016 | $3,414 | $168,700 | $56,900 | $111,800 |
| 2015 | $3,268 | $157,500 | $55,800 | $101,700 |
| 2014 | $3,159 | $157,500 | $55,800 | $101,700 |
| 2013 | $3,117 | $157,500 | $55,800 | $101,700 |
Source: Public Records
Map
Nearby Homes
- 175 Pettaconsett Ave
- 27 Frederick St
- 22 Phillips Ave
- 90 Massachusetts Ave
- 1052 Post Rd
- 77 Kentucky Ave
- 35 Welfare Ave
- 123 Harrington Ave
- 0 Elmwood Ave
- 213 Easton Ave
- 39 Holiday Ave
- 80 George St
- 821 Post Rd
- 150 Riverside Ave
- 15 Christopher Rhodes Way
- 6 Christopher Rhodes Way
- 859 Pontiac Ave
- 20 Commodore Ave
- 136 Sherwood Ave
- 120 Sherwood Ave
Your Personal Tour Guide
Ask me questions while you tour the home.