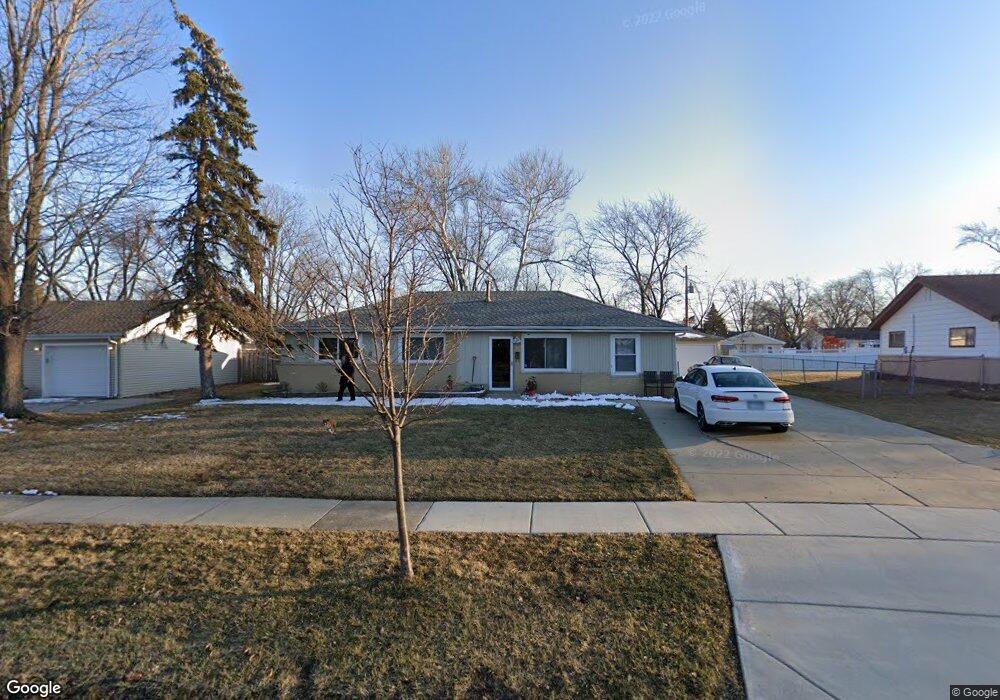
285 Mohave St Hoffman Estates, IL 60169
South Hoffman Estates NeighborhoodEstimated Value: $332,301 - $392,000
3
Beds
1
Bath
1,300
Sq Ft
$283/Sq Ft
Est. Value
About This Home
This home is located at 285 Mohave St, Hoffman Estates, IL 60169 and is currently estimated at $368,075, approximately $283 per square foot. 285 Mohave St is a home located in Cook County with nearby schools including Lakeview Elementary School, Helen Keller Junior High School, and Schaumburg High School.
Ownership History
Date
Name
Owned For
Owner Type
Purchase Details
Closed on
Sep 4, 2014
Sold by
Gonzalez Rafael and Gonzalez Marisol
Bought by
Cervantes Nora Ann
Current Estimated Value
Purchase Details
Closed on
Jul 8, 2008
Sold by
Cervantes Nora A and Cervantes Rafael A
Bought by
Gonzalez Rafael and Gonzalez Marisol
Home Financials for this Owner
Home Financials are based on the most recent Mortgage that was taken out on this home.
Original Mortgage
$160,000
Interest Rate
6.1%
Mortgage Type
Unknown
Create a Home Valuation Report for This Property
The Home Valuation Report is an in-depth analysis detailing your home's value as well as a comparison with similar homes in the area
Home Values in the Area
Average Home Value in this Area
Purchase History
| Date | Buyer | Sale Price | Title Company |
|---|---|---|---|
| Cervantes Nora Ann | -- | None Available | |
| Gonzalez Rafael | $225,000 | Ticor Title Insurance |
Source: Public Records
Mortgage History
| Date | Status | Borrower | Loan Amount |
|---|---|---|---|
| Previous Owner | Gonzalez Rafael | $160,000 |
Source: Public Records
Tax History
| Year | Tax Paid | Tax Assessment Tax Assessment Total Assessment is a certain percentage of the fair market value that is determined by local assessors to be the total taxable value of land and additions on the property. | Land | Improvement |
|---|---|---|---|---|
| 2025 | $3,029 | $29,000 | $7,280 | $21,720 |
| 2024 | $3,029 | $26,000 | $6,240 | $19,760 |
| 2023 | $3,024 | $26,000 | $6,240 | $19,760 |
| 2022 | $3,024 | $26,000 | $6,240 | $19,760 |
| 2021 | $3,322 | $19,520 | $4,420 | $15,100 |
| 2020 | $4,357 | $19,520 | $4,420 | $15,100 |
| 2019 | $5,417 | $21,933 | $4,420 | $17,513 |
| 2018 | $4,231 | $16,411 | $3,900 | $12,511 |
| 2017 | $4,175 | $16,411 | $3,900 | $12,511 |
| 2016 | $4,394 | $17,247 | $3,900 | $13,347 |
| 2015 | $4,242 | $15,830 | $3,380 | $12,450 |
| 2014 | $4,546 | $16,976 | $3,380 | $13,596 |
| 2013 | $4,411 | $16,976 | $3,380 | $13,596 |
Source: Public Records
Map
Nearby Homes
- 260 Mohave St
- 313 Lincoln St
- 200 W Thacker St
- 480 Illinois Blvd
- 345 Maricopa Ln
- 540 Newark Ln
- 625 Morton St
- 395 Washington Blvd
- 230 Princeton St
- 6 Stone Bridge Ct
- 11 Stone Bridge Ct
- 670 Lakeview Ln
- 106 Cedar Ct
- 367 Juniper Tree Ct Unit 3
- 660 Flagstaff Ln
- 10 Waterbury Ln Unit M2
- 5 Illinois Ave
- 860 Olive St
- 26 Waterbury Ln Unit N2
- 829 Linden Cir
Your Personal Tour Guide
Ask me questions while you tour the home.