Estimated Value: $588,000 - $760,516
5
Beds
4
Baths
2,463
Sq Ft
$288/Sq Ft
Est. Value
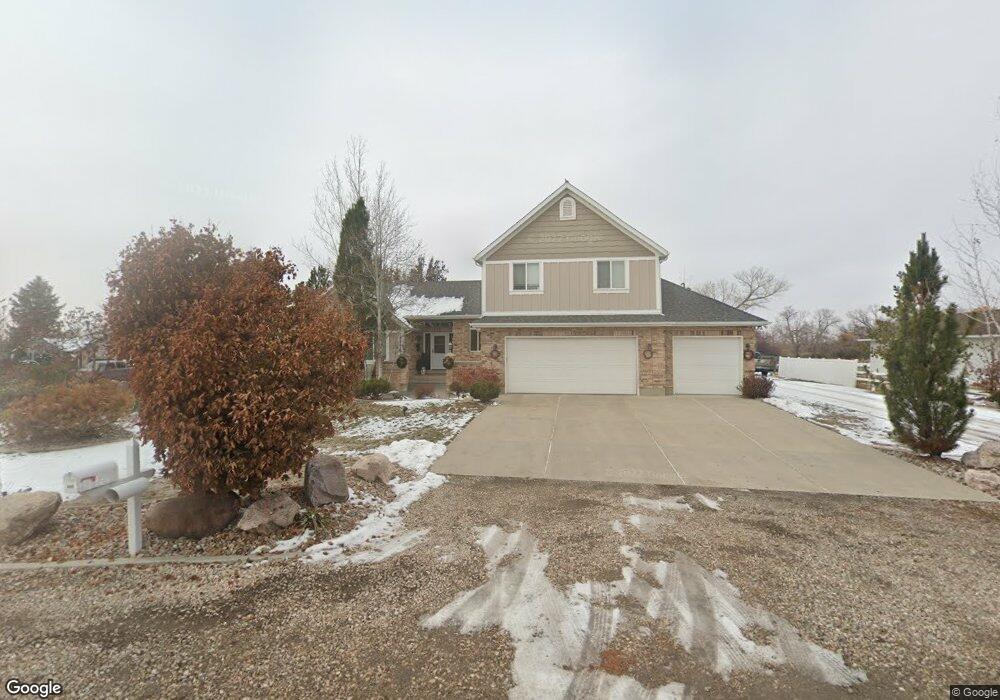
About This Home
This home is located at 285 N 2550 W, Ogden, UT 84404 and is currently estimated at $710,379, approximately $288 per square foot. 285 N 2550 W is a home located in Weber County with nearby schools including West Weber School, Fremont High School, and Venture Academy.
Ownership History
Date
Name
Owned For
Owner Type
Purchase Details
Closed on
Apr 27, 2020
Sold by
Martin Brandon L
Bought by
Martin Angela M and Martin Brandoooooon
Current Estimated Value
Home Financials for this Owner
Home Financials are based on the most recent Mortgage that was taken out on this home.
Original Mortgage
$285,000
Outstanding Balance
$253,954
Interest Rate
3.6%
Mortgage Type
New Conventional
Estimated Equity
$456,425
Purchase Details
Closed on
Oct 7, 2008
Sold by
Martin Brandon
Bought by
Martin Brandon
Purchase Details
Closed on
Aug 4, 2006
Sold by
Yoshida Taeko M
Bought by
Yoshida Taeko M
Purchase Details
Closed on
Jan 28, 2005
Sold by
Miles Kelly B
Bought by
Martin Gary L
Home Financials for this Owner
Home Financials are based on the most recent Mortgage that was taken out on this home.
Original Mortgage
$126,500
Interest Rate
5.81%
Mortgage Type
New Conventional
Purchase Details
Closed on
Feb 20, 1998
Sold by
George Lesley S
Bought by
George Larry A
Create a Home Valuation Report for This Property
The Home Valuation Report is an in-depth analysis detailing your home's value as well as a comparison with similar homes in the area
Home Values in the Area
Average Home Value in this Area
Purchase History
| Date | Buyer | Sale Price | Title Company |
|---|---|---|---|
| Martin Angela M | -- | First American | |
| Martin Brandon | -- | None Available | |
| Yoshida Taeko M | -- | None Available | |
| Martin Gary L | -- | Mountain View Title Ogden | |
| George Larry A | -- | First American Title |
Source: Public Records
Mortgage History
| Date | Status | Borrower | Loan Amount |
|---|---|---|---|
| Open | Martin Angela M | $285,000 | |
| Closed | Martin Gary L | $126,500 |
Source: Public Records
Tax History Compared to Growth
Tax History
| Year | Tax Paid | Tax Assessment Tax Assessment Total Assessment is a certain percentage of the fair market value that is determined by local assessors to be the total taxable value of land and additions on the property. | Land | Improvement |
|---|---|---|---|---|
| 2025 | $3,740 | $711,742 | $189,294 | $522,448 |
| 2024 | $3,597 | $384,448 | $104,111 | $280,337 |
| 2023 | $3,168 | $334,401 | $103,961 | $230,440 |
| 2022 | $3,389 | $364,650 | $87,962 | $276,688 |
| 2021 | $2,811 | $512,001 | $74,298 | $437,703 |
| 2020 | $2,808 | $469,999 | $59,190 | $410,809 |
| 2019 | $2,910 | $461,000 | $52,595 | $408,405 |
| 2018 | $3,026 | $459,582 | $52,595 | $406,987 |
| 2017 | $2,673 | $396,000 | $52,635 | $343,365 |
| 2016 | $2,353 | $189,244 | $28,949 | $160,295 |
| 2015 | $2,378 | $189,244 | $28,949 | $160,295 |
| 2014 | $2,164 | $168,367 | $28,980 | $139,387 |
Source: Public Records
Map
Nearby Homes
- 2445 W 200 S
- 2425 W 200 S
- 2390 W Pioneer Rd
- 377 N 1900 St W
- 1917 W 250 N
- 928 N 2075 W
- 417 S 2025 W
- 3777 W Pioneer Rd
- 1111 N 2000 W Unit 52
- 1111 N 2000 W Unit 123
- 1111 N 2000 W Unit 335
- 1111 N 2000 W Unit 170
- 1111 N 2000 W Unit 222
- 1111 N 2000 W Unit 404
- 1111 N 2000 W Unit 84
- 1111 N 2000 W Unit 201
- 1111 N 2000 W Unit 197
- 1111 N 2000 W Unit 155
- 1111 N 2000 W Unit 105
- 1111 N 2000 W Unit 21