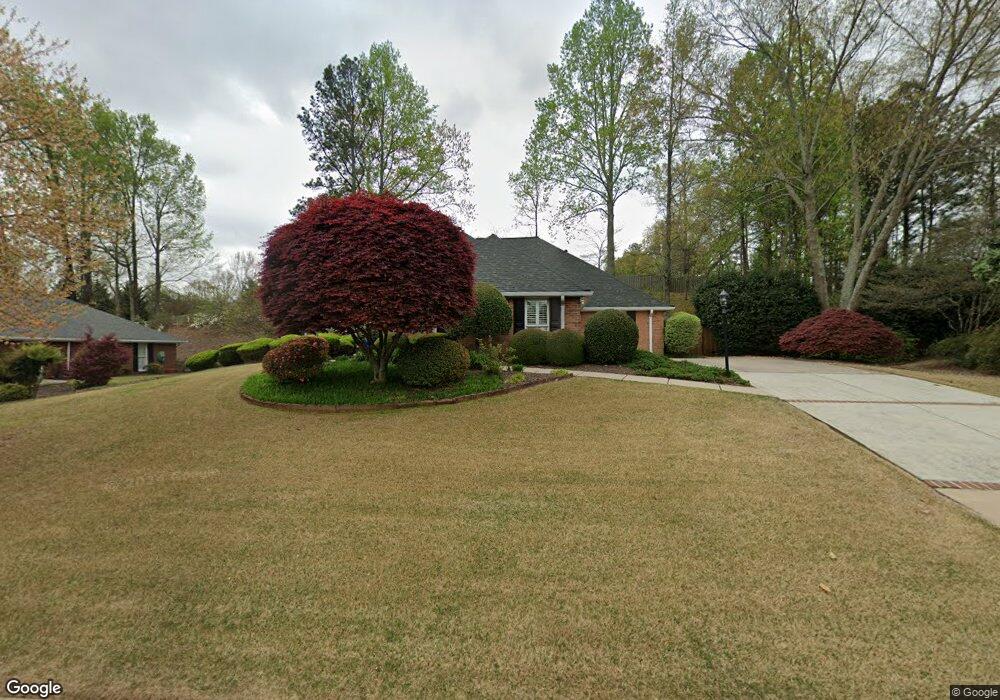
285 N Farm Dr Unit 16 Alpharetta, GA 30004
Estimated Value: $754,000 - $812,000
3
Beds
4
Baths
3,539
Sq Ft
$219/Sq Ft
Est. Value
About This Home
This home is located at 285 N Farm Dr Unit 16, Alpharetta, GA 30004 and is currently estimated at $773,638, approximately $218 per square foot. 285 N Farm Dr Unit 16 is a home located in Fulton County with nearby schools including Crabapple Crossing Elementary School, Northwestern Middle School, and Milton High School.
Ownership History
Date
Name
Owned For
Owner Type
Purchase Details
Closed on
Jan 5, 2024
Sold by
Miller John Harold
Bought by
Miller John Harold Trust and Miller Shelley Bass Trust
Current Estimated Value
Purchase Details
Closed on
Mar 31, 2014
Sold by
Thomason Patricia Annette
Bought by
Miller Shelley and Miller John
Purchase Details
Closed on
May 30, 2006
Sold by
Mock Dennis
Bought by
Thomason Patricia A
Home Financials for this Owner
Home Financials are based on the most recent Mortgage that was taken out on this home.
Original Mortgage
$100,000
Interest Rate
6.44%
Mortgage Type
New Conventional
Purchase Details
Closed on
Dec 16, 2003
Sold by
Karras George T
Bought by
Mock Dennis
Home Financials for this Owner
Home Financials are based on the most recent Mortgage that was taken out on this home.
Original Mortgage
$208,800
Interest Rate
5.82%
Mortgage Type
New Conventional
Create a Home Valuation Report for This Property
The Home Valuation Report is an in-depth analysis detailing your home's value as well as a comparison with similar homes in the area
Home Values in the Area
Average Home Value in this Area
Purchase History
| Date | Buyer | Sale Price | Title Company |
|---|---|---|---|
| Miller John Harold Trust | -- | -- | |
| Miller Shelley | $330,000 | -- | |
| Thomason Patricia A | $325,000 | -- | |
| Mock Dennis | $261,000 | -- |
Source: Public Records
Mortgage History
| Date | Status | Borrower | Loan Amount |
|---|---|---|---|
| Previous Owner | Thomason Patricia A | $100,000 | |
| Previous Owner | Mock Dennis | $208,800 |
Source: Public Records
Tax History Compared to Growth
Tax History
| Year | Tax Paid | Tax Assessment Tax Assessment Total Assessment is a certain percentage of the fair market value that is determined by local assessors to be the total taxable value of land and additions on the property. | Land | Improvement |
|---|---|---|---|---|
| 2025 | $625 | $232,360 | $53,360 | $179,000 |
| 2023 | $6,716 | $237,920 | $69,480 | $168,440 |
| 2022 | $3,070 | $185,320 | $43,840 | $141,480 |
| 2021 | $3,575 | $162,560 | $37,360 | $125,200 |
| 2020 | $3,594 | $160,560 | $36,880 | $123,680 |
| 2019 | $530 | $157,760 | $36,240 | $121,520 |
| 2018 | $3,348 | $137,440 | $29,320 | $108,120 |
| 2017 | $3,000 | $114,760 | $27,560 | $87,200 |
| 2016 | $2,999 | $114,760 | $27,560 | $87,200 |
| 2015 | $3,470 | $114,760 | $27,560 | $87,200 |
| 2014 | $3,127 | $114,760 | $27,560 | $87,200 |
Source: Public Records
Map
Nearby Homes
- 285 N Farm Dr
- 290 Rucker Rd
- 640 Mae Ln
- 1040 Jordan Ln
- 406 Sweet Apple Cir
- 4404 Orchard Trace
- 666 Abbey Ct
- 12440 Brookhill Crossing Ln
- 530 Camber Woods Dr
- 1565 Parkside Dr
- 2230 Ashton Dr
- 1115 Primrose Dr
- 565 Camber Woods Dr
- 216 Lask Ln
- 233 Lask Ln
- 237 Lask Ln
- 13125 Morningpark Cir
- 245 Lask Ln
- 249 Lask Ln
- 580 Stillhouse Ln Unit 2
- 275 N Farm Dr
- 295 N Farm Dr
- 0 N Farm Dr Unit 7285083
- 0 N Farm Dr Unit 7190929
- 0 N Farm Dr Unit 8326719
- 0 N Farm Dr Unit 7599378
- 0 N Farm Dr Unit 7590146
- 0 N Farm Dr Unit 8478924
- 0 N Farm Dr Unit 7166703
- 0 N Farm Dr Unit 8955541
- 0 N Farm Dr Unit 3069193
- 0 N Farm Dr Unit 3158919
- 0 N Farm Dr Unit 7081344
- 0 N Farm Dr Unit 7104933
- N N Farm Dr
- 12203 Limeridge Ct
- 300 N Farm Dr
- 210 Farm Grove Trace
- 310 N Farm Dr Unit 1
- 12207 Limeridge Ct