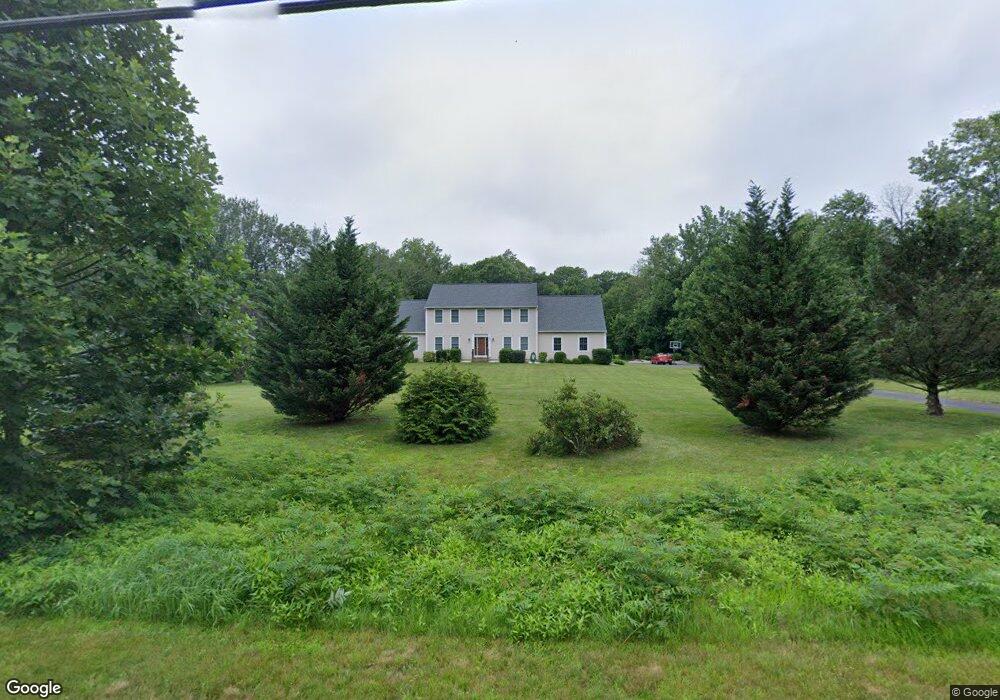
285 N Stone St West Suffield, CT 06093
Estimated Value: $783,000 - $974,000
5
Beds
4
Baths
4,037
Sq Ft
$214/Sq Ft
Est. Value
About This Home
This home is located at 285 N Stone St, West Suffield, CT 06093 and is currently estimated at $863,760, approximately $213 per square foot. 285 N Stone St is a home located in Hartford County with nearby schools including A. Ward Spaulding School, Mcalister Intermediate School, and Suffield Middle School.
Ownership History
Date
Name
Owned For
Owner Type
Purchase Details
Closed on
May 31, 2007
Sold by
Mathvink David and Mathvink Traci
Bought by
Young Adam and Young Kelli
Current Estimated Value
Home Financials for this Owner
Home Financials are based on the most recent Mortgage that was taken out on this home.
Original Mortgage
$417,000
Interest Rate
6.24%
Create a Home Valuation Report for This Property
The Home Valuation Report is an in-depth analysis detailing your home's value as well as a comparison with similar homes in the area
Home Values in the Area
Average Home Value in this Area
Purchase History
| Date | Buyer | Sale Price | Title Company |
|---|---|---|---|
| Young Adam | $538,000 | -- |
Source: Public Records
Mortgage History
| Date | Status | Borrower | Loan Amount |
|---|---|---|---|
| Open | Young Adam | $412,000 | |
| Closed | Young Adam | $417,000 | |
| Closed | Young Adam | $94,100 |
Source: Public Records
Tax History
| Year | Tax Paid | Tax Assessment Tax Assessment Total Assessment is a certain percentage of the fair market value that is determined by local assessors to be the total taxable value of land and additions on the property. | Land | Improvement |
|---|---|---|---|---|
| 2025 | $11,908 | $508,690 | $73,500 | $435,190 |
| 2024 | $11,512 | $508,690 | $73,500 | $435,190 |
| 2023 | $10,180 | $355,810 | $73,640 | $282,170 |
| 2022 | $10,180 | $355,810 | $73,640 | $282,170 |
| 2021 | $10,190 | $355,810 | $73,640 | $282,170 |
| 2020 | $10,190 | $355,810 | $73,640 | $282,170 |
| 2019 | $10,008 | $348,460 | $73,640 | $274,820 |
| 2018 | $10,207 | $348,110 | $72,940 | $275,170 |
| 2017 | $10,037 | $347,410 | $72,940 | $274,470 |
| 2016 | $9,797 | $347,410 | $72,940 | $274,470 |
| 2015 | $9,651 | $347,410 | $72,940 | $274,470 |
| 2014 | $9,422 | $347,410 | $72,940 | $274,470 |
Source: Public Records
Map
Nearby Homes
- 1054 Mountain Rd
- 15 Austin Brook Dr
- 2 Stratton Farms Rd
- 200 N Main St
- 187 Griffin Rd
- 191 N Main St
- 02 S Grand St
- 01 S Grand St
- 7 Rising Corner Rd
- 24 Coppergate Rd
- 1095 S Grand St
- 485 Mountain Rd
- 4066 Mountain Rd
- 15 Downing Way
- 3 Evergreen St
- 384 Pine St
- 18 Daniel Cir Unit 18
- 1 E Elaine Dr
- 420 Halladay Ave W
- 0 Suffield St Unit 24093452
Your Personal Tour Guide
Ask me questions while you tour the home.