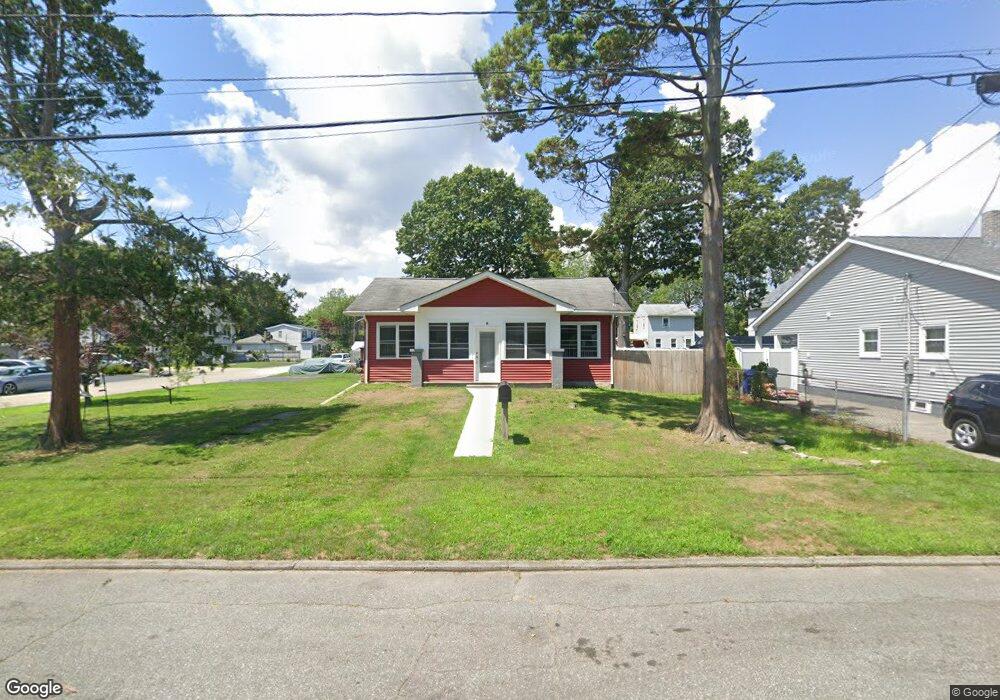
285 Pequot Ave Warwick, RI 02889
Oakland Beach NeighborhoodEstimated Value: $409,930 - $469,000
2
Beds
1
Bath
1,992
Sq Ft
$219/Sq Ft
Est. Value
About This Home
This home is located at 285 Pequot Ave, Warwick, RI 02889 and is currently estimated at $436,233, approximately $218 per square foot. 285 Pequot Ave is a home located in Kent County with nearby schools including Saint Kevin School and Bishop Hendricken High School.
Ownership History
Date
Name
Owned For
Owner Type
Purchase Details
Closed on
May 23, 1994
Sold by
Palardy Omer and Palardy Ida
Bought by
Dowding Gary T
Current Estimated Value
Home Financials for this Owner
Home Financials are based on the most recent Mortgage that was taken out on this home.
Original Mortgage
$80,700
Interest Rate
8.44%
Mortgage Type
Purchase Money Mortgage
Create a Home Valuation Report for This Property
The Home Valuation Report is an in-depth analysis detailing your home's value as well as a comparison with similar homes in the area
Home Values in the Area
Average Home Value in this Area
Purchase History
| Date | Buyer | Sale Price | Title Company |
|---|---|---|---|
| Dowding Gary T | $85,000 | -- |
Source: Public Records
Mortgage History
| Date | Status | Borrower | Loan Amount |
|---|---|---|---|
| Open | Dowding Gary T | $181,800 | |
| Closed | Dowding Gary T | $192,000 | |
| Closed | Dowding Gary T | $170,000 | |
| Closed | Dowding Gary T | $80,700 |
Source: Public Records
Tax History Compared to Growth
Tax History
| Year | Tax Paid | Tax Assessment Tax Assessment Total Assessment is a certain percentage of the fair market value that is determined by local assessors to be the total taxable value of land and additions on the property. | Land | Improvement |
|---|---|---|---|---|
| 2025 | $4,717 | $371,400 | $105,500 | $265,900 |
| 2024 | $4,516 | $312,100 | $91,800 | $220,300 |
| 2023 | $4,429 | $312,100 | $91,800 | $220,300 |
| 2022 | $4,160 | $222,100 | $54,900 | $167,200 |
| 2021 | $4,160 | $222,100 | $54,900 | $167,200 |
| 2020 | $4,160 | $222,100 | $54,900 | $167,200 |
| 2019 | $4,160 | $222,100 | $54,900 | $167,200 |
| 2018 | $3,694 | $177,600 | $54,900 | $122,700 |
| 2017 | $3,595 | $177,600 | $54,900 | $122,700 |
| 2016 | $3,595 | $177,600 | $54,900 | $122,700 |
| 2015 | $3,845 | $185,300 | $64,400 | $120,900 |
| 2014 | $3,717 | $185,300 | $64,400 | $120,900 |
| 2013 | $3,667 | $185,300 | $64,400 | $120,900 |
Source: Public Records
Map
Nearby Homes