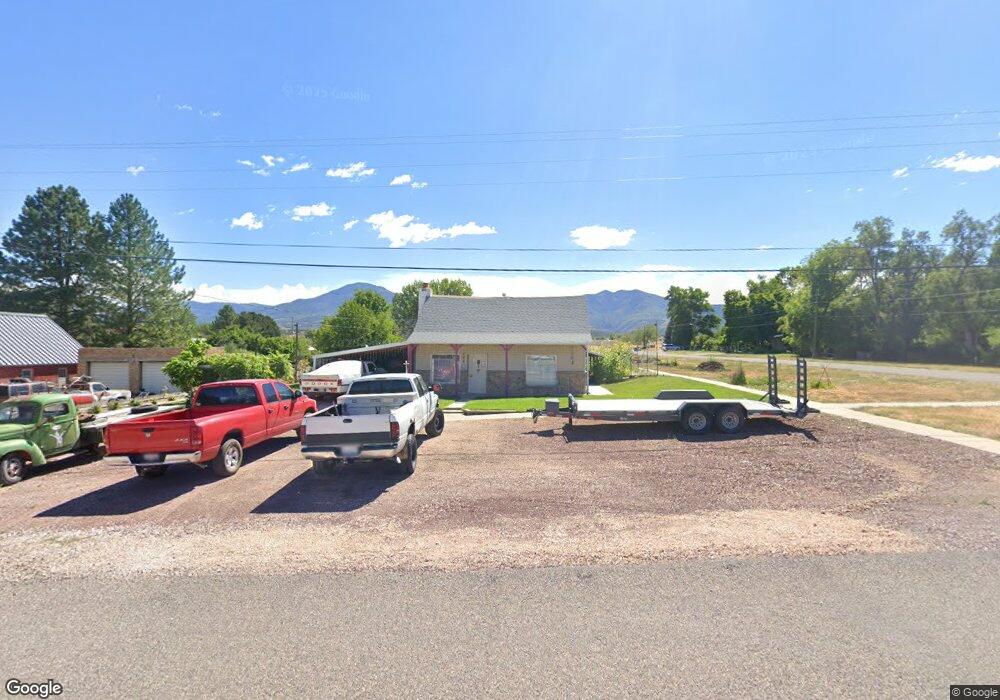
285 S 200 E Fillmore, UT 84631
Estimated Value: $221,421 - $296,000
2
Beds
1
Bath
1,360
Sq Ft
$185/Sq Ft
Est. Value
About This Home
This home is located at 285 S 200 E, Fillmore, UT 84631 and is currently estimated at $251,855, approximately $185 per square foot. 285 S 200 E is a home located in Millard County.
Ownership History
Date
Name
Owned For
Owner Type
Purchase Details
Closed on
Nov 16, 2022
Sold by
H Lavar Cloward Family Trust
Bought by
Droescher David
Current Estimated Value
Purchase Details
Closed on
Jun 13, 2011
Sold by
Cloward Lavar and Cloward Lavon
Bought by
Demaranville Cloward H and Demaranville Julie
Purchase Details
Closed on
Jan 20, 2010
Sold by
Gren David and Gren Maureen
Bought by
Turner Roland J and Turner Jacqueline A
Create a Home Valuation Report for This Property
The Home Valuation Report is an in-depth analysis detailing your home's value as well as a comparison with similar homes in the area
Home Values in the Area
Average Home Value in this Area
Purchase History
| Date | Buyer | Sale Price | Title Company |
|---|---|---|---|
| Droescher David | -- | First American Title | |
| Demaranville Cloward H | -- | -- | |
| Turner Roland J | -- | -- |
Source: Public Records
Tax History
| Year | Tax Paid | Tax Assessment Tax Assessment Total Assessment is a certain percentage of the fair market value that is determined by local assessors to be the total taxable value of land and additions on the property. | Land | Improvement |
|---|---|---|---|---|
| 2025 | -- | $137,496 | $23,670 | $113,826 |
| 2024 | $103,363 | $103,363 | $20,292 | $83,071 |
| 2023 | $103,363 | $103,363 | $20,292 | $83,071 |
| 2022 | $940 | $84,404 | $18,448 | $65,956 |
| 2021 | $813 | $70,083 | $11,979 | $58,104 |
| 2020 | $752 | $65,225 | $10,890 | $54,335 |
| 2019 | $645 | $56,137 | $10,890 | $45,247 |
| 2018 | $616 | $54,861 | $10,890 | $43,971 |
| 2017 | $425 | $35,991 | $10,148 | $25,843 |
| 2016 | $407 | $35,991 | $10,148 | $25,843 |
| 2015 | $407 | $35,991 | $10,148 | $25,843 |
| 2014 | -- | $35,991 | $10,148 | $25,843 |
| 2013 | -- | $35,991 | $10,148 | $25,843 |
Source: Public Records
Map
Nearby Homes
- 235 S 200 St E
- 430 E Canyon Rd
- 157 E 500 South St
- 155 E 500 St S
- 40 S 100 Rd E
- 405 E 500 St S
- 465 S 100 W
- 155 W Center St
- 75 N 100 West St
- 690 E 500 S
- 260 W 200 S
- 760 E 700 St S
- 351 W 100 South St
- 750 800 South Fillmore
- 825 800 South Fillmore
- 800 800 South Fillmore
- 225 W 200 St N
- 775 E Valley View Rd
- 245 W 300 N
- 390 N 100 W
Your Personal Tour Guide
Ask me questions while you tour the home.