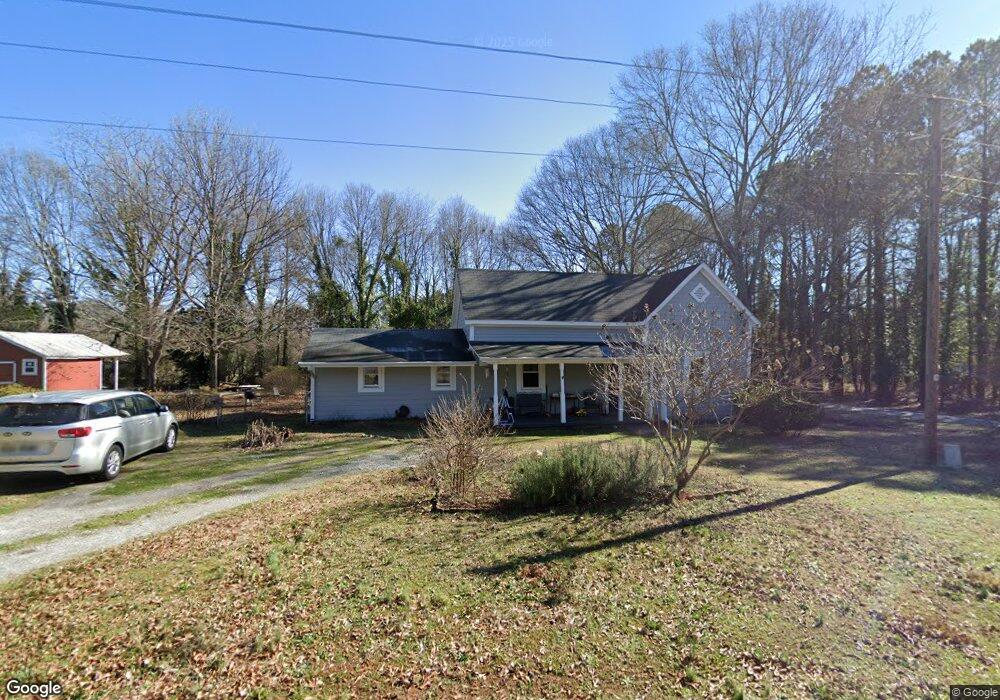
285 S 5th St Colbert, GA 30628
Estimated Value: $245,663 - $290,000
3
Beds
2
Baths
1,328
Sq Ft
$202/Sq Ft
Est. Value
About This Home
This home is located at 285 S 5th St, Colbert, GA 30628 and is currently estimated at $268,916, approximately $202 per square foot. 285 S 5th St is a home located in Madison County with nearby schools including Madison County High School.
Ownership History
Date
Name
Owned For
Owner Type
Purchase Details
Closed on
Aug 12, 2022
Sold by
Smith Winfield C
Bought by
Smith Winfield C and Smith Carroll Winfield
Current Estimated Value
Home Financials for this Owner
Home Financials are based on the most recent Mortgage that was taken out on this home.
Original Mortgage
$50,000
Outstanding Balance
$46,872
Interest Rate
5.51%
Mortgage Type
New Conventional
Estimated Equity
$222,044
Purchase Details
Closed on
Jul 31, 2006
Sold by
Johnson Aubrey
Bought by
Smith Winfield C
Home Financials for this Owner
Home Financials are based on the most recent Mortgage that was taken out on this home.
Original Mortgage
$112,000
Interest Rate
6.63%
Mortgage Type
New Conventional
Purchase Details
Closed on
Nov 7, 2003
Sold by
Prudential Residential Service
Bought by
Johnson Audrey
Purchase Details
Closed on
Jul 28, 2000
Sold by
Norman Tracy Alan
Bought by
Baker Edward A and Baker Hea
Purchase Details
Closed on
Jan 1, 1989
Bought by
Norman Tracy Alan
Create a Home Valuation Report for This Property
The Home Valuation Report is an in-depth analysis detailing your home's value as well as a comparison with similar homes in the area
Home Values in the Area
Average Home Value in this Area
Purchase History
| Date | Buyer | Sale Price | Title Company |
|---|---|---|---|
| Smith Winfield C | -- | -- | |
| Smith Winfield C | $140,000 | -- | |
| Johnson Audrey | $75,000 | -- | |
| Prudential Residential Services | $75,000 | -- | |
| Baker Edward A | $55,000 | -- | |
| Norman Tracy Alan | $20,000 | -- |
Source: Public Records
Mortgage History
| Date | Status | Borrower | Loan Amount |
|---|---|---|---|
| Open | Smith Winfield C | $50,000 | |
| Previous Owner | Smith Winfield C | $112,000 | |
| Previous Owner | Smith Winfield C | $14,000 |
Source: Public Records
Tax History Compared to Growth
Tax History
| Year | Tax Paid | Tax Assessment Tax Assessment Total Assessment is a certain percentage of the fair market value that is determined by local assessors to be the total taxable value of land and additions on the property. | Land | Improvement |
|---|---|---|---|---|
| 2024 | $1,860 | $64,108 | $12,800 | $51,308 |
| 2023 | $2,631 | $75,607 | $17,779 | $57,828 |
| 2022 | $1,887 | $63,322 | $12,218 | $51,104 |
| 2021 | $1,539 | $46,075 | $9,774 | $36,301 |
| 2020 | $1,496 | $44,654 | $8,353 | $36,301 |
| 2019 | $1,488 | $43,967 | $8,353 | $35,614 |
| 2018 | $1,448 | $42,332 | $7,642 | $34,690 |
| 2017 | $1,194 | $35,671 | $7,111 | $28,560 |
| 2016 | $892 | $31,609 | $6,465 | $25,144 |
| 2015 | $889 | $31,609 | $6,465 | $25,144 |
| 2014 | $886 | $31,473 | $5,825 | $25,648 |
| 2013 | -- | $31,473 | $5,825 | $25,648 |
Source: Public Records
Map
Nearby Homes
- 180 S 4th St
- 0 2nd Ave
- 49 Kristin Ct
- 0 Bluff Rd Unit 10591799
- 45 Southwinds Dr
- 0 Colbert School Rd Unit 10446405
- 1579 Shoal Creek Rd
- 00 Kingston Rd
- 270 Lola St
- 120 Harold's Way
- 95 Lola St
- 2596 Hardman Morris Rd
- 118 Kingston Rd
- 0 Kincaid Cemetery Rd Unit 10626668
- 0 Kincaid Cemetery Rd Unit 7662961
- 0 Kincaid Cemetery Rd Unit CL341804
- 0 Kingston Rd Unit 10531125
- 75 Madison Ave
- 208 Redbud Trail Unit 48
- 77 Sugar Maple Way Unit 44