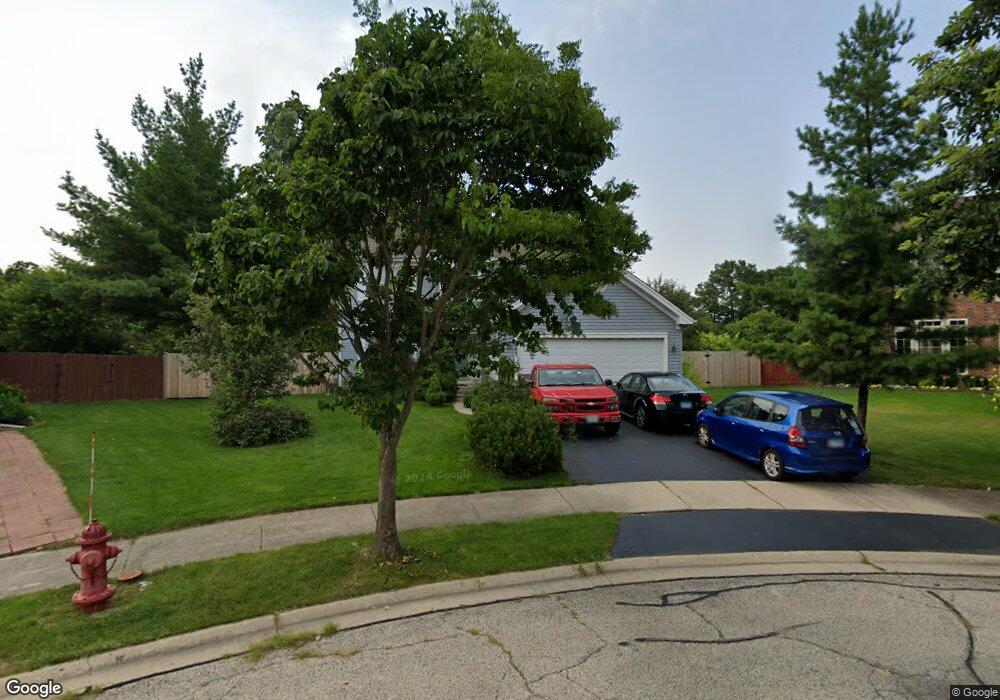
285 S Hackberry Ct Round Lake, IL 60073
Estimated Value: $354,000 - $374,000
4
Beds
3
Baths
1,920
Sq Ft
$190/Sq Ft
Est. Value
About This Home
This home is located at 285 S Hackberry Ct, Round Lake, IL 60073 and is currently estimated at $364,335, approximately $189 per square foot. 285 S Hackberry Ct is a home located in Lake County with nearby schools including Village Elementary School, John T. Magee Middle School, and Round Lake High School.
Ownership History
Date
Name
Owned For
Owner Type
Purchase Details
Closed on
Nov 30, 2000
Sold by
Cox Rickey E
Bought by
Cox Rickey E and Cox Jolinda F
Current Estimated Value
Home Financials for this Owner
Home Financials are based on the most recent Mortgage that was taken out on this home.
Original Mortgage
$195,600
Outstanding Balance
$72,599
Interest Rate
7.8%
Mortgage Type
VA
Estimated Equity
$291,736
Purchase Details
Closed on
Jun 14, 2000
Sold by
Olhausen Kurt M and Olhausen Wendy M
Bought by
Cox Rickey E
Home Financials for this Owner
Home Financials are based on the most recent Mortgage that was taken out on this home.
Original Mortgage
$194,052
Interest Rate
8.24%
Mortgage Type
VA
Purchase Details
Closed on
Apr 30, 1996
Sold by
Kimball Hill Inc
Bought by
Ulhausen Kurt M and Olhausen Wendy M
Home Financials for this Owner
Home Financials are based on the most recent Mortgage that was taken out on this home.
Original Mortgage
$141,050
Interest Rate
7.86%
Create a Home Valuation Report for This Property
The Home Valuation Report is an in-depth analysis detailing your home's value as well as a comparison with similar homes in the area
Home Values in the Area
Average Home Value in this Area
Purchase History
| Date | Buyer | Sale Price | Title Company |
|---|---|---|---|
| Cox Rickey E | -- | -- | |
| Cox Rickey E | $188,500 | Prairie Title | |
| Ulhausen Kurt M | $176,500 | Chicago Title Insurance Co |
Source: Public Records
Mortgage History
| Date | Status | Borrower | Loan Amount |
|---|---|---|---|
| Open | Cox Rickey E | $195,600 | |
| Previous Owner | Cox Rickey E | $194,052 | |
| Previous Owner | Ulhausen Kurt M | $141,050 |
Source: Public Records
Tax History Compared to Growth
Tax History
| Year | Tax Paid | Tax Assessment Tax Assessment Total Assessment is a certain percentage of the fair market value that is determined by local assessors to be the total taxable value of land and additions on the property. | Land | Improvement |
|---|---|---|---|---|
| 2024 | $8,251 | $96,449 | $16,264 | $80,185 |
| 2023 | $7,616 | $88,518 | $14,927 | $73,591 |
| 2022 | $7,616 | $78,851 | $10,883 | $67,968 |
| 2021 | $8,047 | $75,789 | $10,460 | $65,329 |
| 2020 | $7,708 | $72,111 | $9,952 | $62,159 |
| 2019 | $7,516 | $69,184 | $9,548 | $59,636 |
| 2018 | $8,415 | $68,204 | $16,399 | $51,805 |
| 2017 | $8,258 | $64,156 | $15,426 | $48,730 |
| 2016 | $7,950 | $59,223 | $14,240 | $44,983 |
| 2015 | $7,676 | $54,104 | $13,009 | $41,095 |
| 2014 | $7,613 | $55,129 | $12,363 | $42,766 |
| 2012 | $7,567 | $57,576 | $12,912 | $44,664 |
Source: Public Records
Map
Nearby Homes
- 504 W Forest Ave
- 0 S Cedar Lake Rd Unit MRD12365608
- 472 W Savoy Dr
- 33 S Treehouse Ln Unit 73
- 321 W Whispering Oaks Ln Unit 336
- 13 Lincoln Ave
- 30 S Macgillis Dr Unit 201
- 47 S Treehouse Ln Unit 83
- 337 W Treehouse Ln Unit 112
- 602 S Rosehall Ln
- 108 Lincoln Ave
- 110 Lincoln Ave
- 124 W Buckingham Dr Unit 134
- 714 S Rosehall Ln Unit 3
- 407 W Waterbury Dr
- 801 S Parkside Dr Unit 4
- 175 Davis Ct
- 31101 N Fairfield Rd
- 345 W Asbury Dr
- 479 W Butterfield Ln
- 292 S Hackberry Ct
- 289 S Hackberry Ct
- 293 S Hackberry Ct
- 300 S Hackberry Ct
- 308 S Hackberry Ct
- 526 W Weeping Willow Rd Unit 6
- 542 W Weeping Willow Rd Unit 7
- 516 W Weeping Willow Rd
- 537 W Weeping Willow Rd
- 531 W Weeping Willow Rd
- 546 W Weeping Willow Rd
- 543 W Weeping Willow Rd
- 506 W Weeping Willow Rd
- 517 W Weeping Willow Rd Unit 6
- 549 W Weeping Willow Rd
- 550 W Weeping Willow Rd
- 505 W Weeping Willow Rd
- 334 S Clearview Cir
- 494 W Weeping Willow Rd
- 340 S Clearview Cir