Estimated Value: $361,263 - $389,000
4
Beds
3
Baths
1,964
Sq Ft
$191/Sq Ft
Est. Value
About This Home
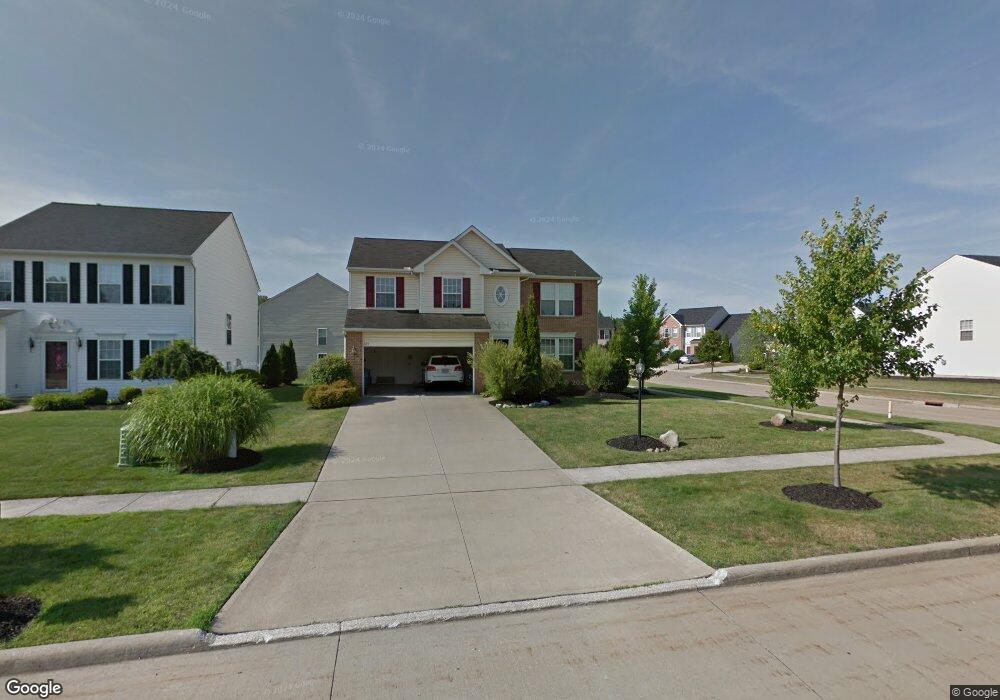
This home is located at 285 Sandstone Ridge Way, Berea, OH 44017 and is currently estimated at $374,566, approximately $190 per square foot. 285 Sandstone Ridge Way is a home located in Cuyahoga County with nearby schools including Falls-Lenox Primary Elementary School, Olmsted Falls Intermediate Building, and Olmsted Falls Middle School.
Ownership History
Date
Name
Owned For
Owner Type
Purchase Details
Closed on
Jan 28, 2006
Sold by
Sfarijiani Anita
Bought by
Nimako Yeboah Kwesi
Current Estimated Value
Purchase Details
Closed on
Feb 2, 2005
Sold by
Nvr Inc
Bought by
Yeboah Kwesi N and Sfarijiani Anita
Home Financials for this Owner
Home Financials are based on the most recent Mortgage that was taken out on this home.
Original Mortgage
$186,300
Interest Rate
5.12%
Mortgage Type
Purchase Money Mortgage
Purchase Details
Closed on
Nov 1, 2004
Sold by
Lopat Development Co Ii Llc
Bought by
Nvr Inc and Ryan Homes
Create a Home Valuation Report for This Property
The Home Valuation Report is an in-depth analysis detailing your home's value as well as a comparison with similar homes in the area
Home Values in the Area
Average Home Value in this Area
Purchase History
| Date | Buyer | Sale Price | Title Company |
|---|---|---|---|
| Nimako Yeboah Kwesi | $224,400 | None Available | |
| Yeboah Kwesi N | $196,115 | Nvr Title Agency | |
| Nvr Inc | $36,000 | Nvr Title Agency |
Source: Public Records
Mortgage History
| Date | Status | Borrower | Loan Amount |
|---|---|---|---|
| Previous Owner | Yeboah Kwesi N | $186,300 |
Source: Public Records
Tax History Compared to Growth
Tax History
| Year | Tax Paid | Tax Assessment Tax Assessment Total Assessment is a certain percentage of the fair market value that is determined by local assessors to be the total taxable value of land and additions on the property. | Land | Improvement |
|---|---|---|---|---|
| 2024 | $6,440 | $108,990 | $20,405 | $88,585 |
| 2023 | $5,801 | $84,000 | $18,410 | $65,590 |
| 2022 | $5,765 | $84,000 | $18,410 | $65,590 |
| 2021 | $5,749 | $84,000 | $18,410 | $65,590 |
| 2020 | $5,883 | $76,370 | $16,730 | $59,640 |
| 2019 | $5,727 | $218,200 | $47,800 | $170,400 |
| 2018 | $5,562 | $76,370 | $16,730 | $59,640 |
| 2017 | $5,822 | $72,450 | $14,560 | $57,890 |
| 2016 | $5,779 | $72,450 | $14,560 | $57,890 |
| 2015 | $5,355 | $72,450 | $14,560 | $57,890 |
| 2014 | $5,355 | $71,020 | $14,280 | $56,740 |
Source: Public Records
Map
Nearby Homes
- 7587 Lewis Rd
- 228 Stone Ridge Way
- 260 Stone Ridge Way
- 0 River Rd Unit 5169658
- 100 River Rock Way
- 136 River Rock Way Unit D
- 109 Marble Ct
- 281-12-007 River Rd
- 281-12-024 River Rd
- 361 Chestnut Dr
- 351 Lombardy Dr
- 7593 Columbia Rd
- 7030 Columbia Rd
- V/L Columbia Rd
- 8241 Lewis Rd
- 3 Dogwood Ln
- 25725 Cook Rd
- 5 Hawthorn Dr
- 0
- 11 Brookins Dr
- 279 Sandstone Ridge Way
- 303 Sandstone Ridge Way
- 273 Sandstone Ridge Way
- 120 Granite Ct
- 309 Sandstone Ridge Way
- 101 Bedrock Ct
- 267 Sandstone Ridge Way
- 101 Granite Ct
- 114 Granite Ct
- 107 Bedrock Ct
- 290 Sandstone Ridge Way
- 109 Granite Ct
- 284 Sandstone Ridge Way
- 107 Granite Ct
- 296 Sandstone Ridge Way
- 278 Sandstone Ridge Way
- 310 Sandstone Ridge Way
- 109 Bedrock Ct
- 304 Sandstone Ridge Way
- 272 Sandstone Ridge Way