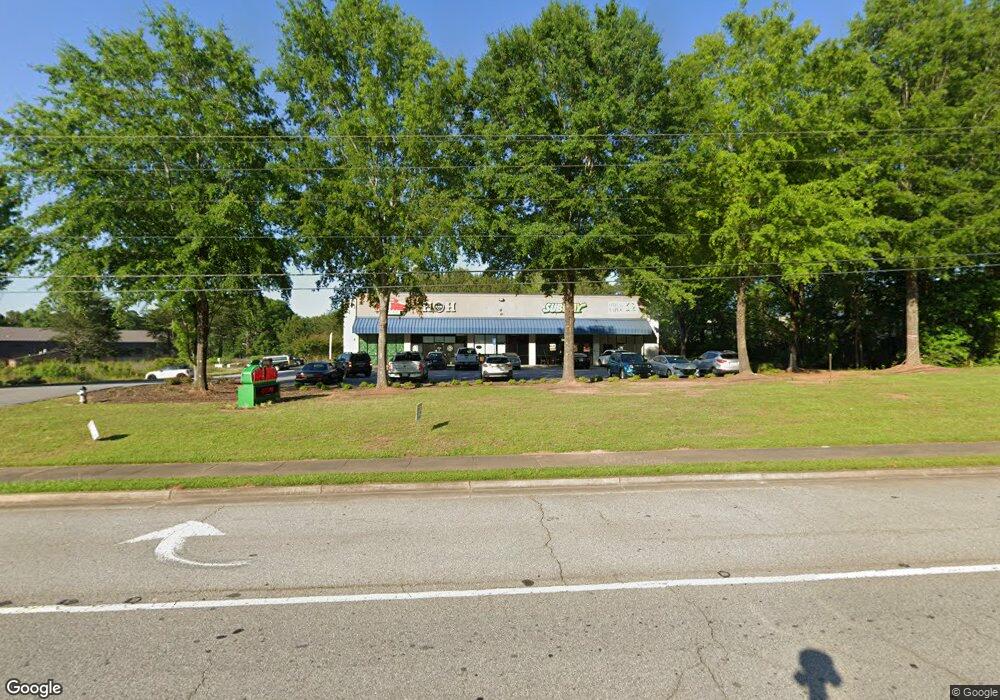
285 Temple Ave Newnan, GA 30263
Estimated Value: $920,567
--
Bed
--
Bath
6,000
Sq Ft
$153/Sq Ft
Est. Value
About This Home
This home is located at 285 Temple Ave, Newnan, GA 30263 and is currently estimated at $920,567, approximately $153 per square foot. 285 Temple Ave is a home located in Coweta County with nearby schools including Elm Street Elementary School, Evans Middle School, and Newnan High School.
Ownership History
Date
Name
Owned For
Owner Type
Purchase Details
Closed on
May 26, 2022
Sold by
Technoworld Consultants Inc
Bought by
2414 16 Cambreleng Llc
Current Estimated Value
Purchase Details
Closed on
May 18, 2021
Sold by
Bbwj Llc
Bought by
Technoworld Consultants Inc
Home Financials for this Owner
Home Financials are based on the most recent Mortgage that was taken out on this home.
Original Mortgage
$540,000
Interest Rate
3.1%
Mortgage Type
Commercial
Purchase Details
Closed on
Apr 3, 2012
Sold by
Bbwj Llc
Bought by
United Community Bank
Purchase Details
Closed on
Dec 5, 2003
Sold by
Cranford John H
Bought by
Bbwj Llc
Home Financials for this Owner
Home Financials are based on the most recent Mortgage that was taken out on this home.
Original Mortgage
$410,250
Interest Rate
5.97%
Mortgage Type
Commercial
Purchase Details
Closed on
Nov 30, 1979
Bought by
Coweta Investments L
Create a Home Valuation Report for This Property
The Home Valuation Report is an in-depth analysis detailing your home's value as well as a comparison with similar homes in the area
Home Values in the Area
Average Home Value in this Area
Purchase History
| Date | Buyer | Sale Price | Title Company |
|---|---|---|---|
| 2414 16 Cambreleng Llc | $1,300,000 | -- | |
| Technoworld Consultants Inc | $700,000 | -- | |
| United Community Bank | $150,000 | -- | |
| Bbwj Llc | $285,000 | -- | |
| Coweta Investments L | -- | -- |
Source: Public Records
Mortgage History
| Date | Status | Borrower | Loan Amount |
|---|---|---|---|
| Previous Owner | Technoworld Consultants Inc | $540,000 | |
| Previous Owner | Bbwj Llc | $410,250 |
Source: Public Records
Tax History Compared to Growth
Tax History
| Year | Tax Paid | Tax Assessment Tax Assessment Total Assessment is a certain percentage of the fair market value that is determined by local assessors to be the total taxable value of land and additions on the property. | Land | Improvement |
|---|---|---|---|---|
| 2024 | $10,816 | $473,327 | $41,153 | $432,174 |
| 2023 | $10,816 | $475,078 | $41,153 | $433,925 |
| 2022 | $6,476 | $266,152 | $34,808 | $231,344 |
| 2021 | $6,113 | $227,457 | $34,808 | $192,649 |
| 2020 | $5,468 | $198,942 | $34,808 | $164,134 |
| 2019 | $6,173 | $205,502 | $34,808 | $170,694 |
| 2018 | $6,210 | $205,502 | $34,808 | $170,694 |
| 2017 | $6,184 | $205,502 | $34,808 | $170,694 |
| 2016 | $6,188 | $205,502 | $34,808 | $170,694 |
| 2015 | $6,198 | $205,502 | $34,808 | $170,694 |
| 2014 | $6,062 | $205,502 | $34,808 | $170,694 |
Source: Public Records
Map
Nearby Homes
- 0 W Hwy 34 Unit 10379383
- 0 W Hwy 34 Unit 7457396
- 88 Atlantica Dr Unit 27
- 0 Benelli Ridge Unit 10429105
- 7 Maple Dr
- 17 Brookwood Dr
- 9 Brookwood Dr
- 18 Belmont Park Ln
- 30 Elm Cir
- 25 Highland Park Dr
- 4 Thomas Way
- 85 Franklin Rd
- 2 Belmont Park Dr
- 169 W Washington St
- 5 Westgate Park Ln
- 1 Ellis Way
- 14 Hamilton Bohannon Dr
- 8 Westgate Park Ct
- 100 Lovelace St
- 16 Hamilton Bohannon Dr
- 273 Temple Ave
- 261 Temple Ave
- 259 Temple Ave
- 269 Temple Ave
- 253 Temple Ave
- 0 Evans Dr
- 0 Evans Dr Unit 7589766
- 0 Evans Dr Unit 7144079
- 0 Evans Dr Unit 3111373
- 0 Evans Dr Unit 8053144
- 0 Evans Dr Unit 8135956
- 23 Douglas Dr
- 28 Douglas Dr
- 249 Temple Ave Unit 249-277
- 249 Temple Ave
- 24 Douglas Dr
- 19 Douglas Dr
- 15 West St
- 12 Douglas Dr
- 17 Franklin Rd