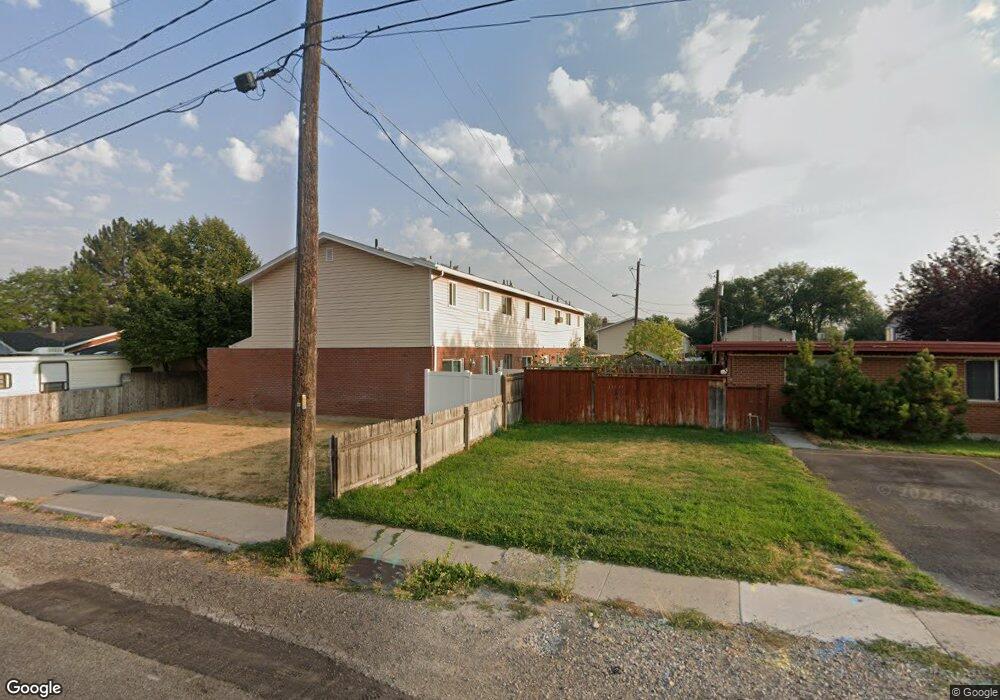
285 W 600 N Unit 4 Logan, UT 84321
Ellis NeighborhoodEstimated Value: $226,000 - $240,000
2
Beds
2
Baths
954
Sq Ft
$247/Sq Ft
Est. Value
About This Home
This home is located at 285 W 600 N Unit 4, Logan, UT 84321 and is currently estimated at $235,921, approximately $247 per square foot. 285 W 600 N Unit 4 is a home located in Cache County with nearby schools including Bridger School, Mount Logan Middle School, and Logan High School.
Ownership History
Date
Name
Owned For
Owner Type
Purchase Details
Closed on
Apr 12, 2019
Sold by
Lynch Jason J
Bought by
Bank Of Utah
Current Estimated Value
Purchase Details
Closed on
Feb 1, 2010
Sold by
Holmes Adam W
Bought by
Brown James O
Home Financials for this Owner
Home Financials are based on the most recent Mortgage that was taken out on this home.
Original Mortgage
$83,968
Interest Rate
5.03%
Mortgage Type
VA
Purchase Details
Closed on
Aug 25, 2009
Sold by
Moss Jennifer A
Bought by
Holmes Adam W
Purchase Details
Closed on
Dec 26, 2001
Sold by
Hart Linda R
Bought by
Hart Tyler J and Hart Heather M
Home Financials for this Owner
Home Financials are based on the most recent Mortgage that was taken out on this home.
Original Mortgage
$51,000
Interest Rate
6.51%
Create a Home Valuation Report for This Property
The Home Valuation Report is an in-depth analysis detailing your home's value as well as a comparison with similar homes in the area
Home Values in the Area
Average Home Value in this Area
Purchase History
| Date | Buyer | Sale Price | Title Company |
|---|---|---|---|
| Bank Of Utah | -- | Hickman Land Title Logan | |
| Brown James O | -- | Heritage Title | |
| Holmes Adam W | -- | Heritage Title | |
| Hart Tyler J | -- | -- |
Source: Public Records
Mortgage History
| Date | Status | Borrower | Loan Amount |
|---|---|---|---|
| Previous Owner | Brown James O | $83,968 | |
| Previous Owner | Hart Tyler J | $51,000 |
Source: Public Records
Tax History
| Year | Tax Paid | Tax Assessment Tax Assessment Total Assessment is a certain percentage of the fair market value that is determined by local assessors to be the total taxable value of land and additions on the property. | Land | Improvement |
|---|---|---|---|---|
| 2025 | $993 | $128,365 | $0 | $0 |
| 2024 | $1,023 | $128,150 | $0 | $0 |
| 2023 | $1,165 | $139,150 | $0 | $0 |
| 2022 | $12 | $130,895 | $0 | $0 |
| 2021 | $940 | $161,920 | $25,000 | $136,920 |
| 2020 | $897 | $139,100 | $25,000 | $114,100 |
| 2019 | $791 | $117,379 | $25,000 | $92,379 |
| 2018 | $763 | $103,288 | $25,000 | $78,288 |
| 2017 | $691 | $49,445 | $0 | $0 |
| 2016 | $716 | $41,305 | $0 | $0 |
| 2015 | $599 | $41,305 | $0 | $0 |
| 2014 | $539 | $41,135 | $0 | $0 |
| 2013 | -- | $41,135 | $0 | $0 |
Source: Public Records
Map
Nearby Homes
Your Personal Tour Guide
Ask me questions while you tour the home.