Estimated Value: $697,291 - $827,000
4
Beds
2
Baths
2,165
Sq Ft
$342/Sq Ft
Est. Value
About This Home
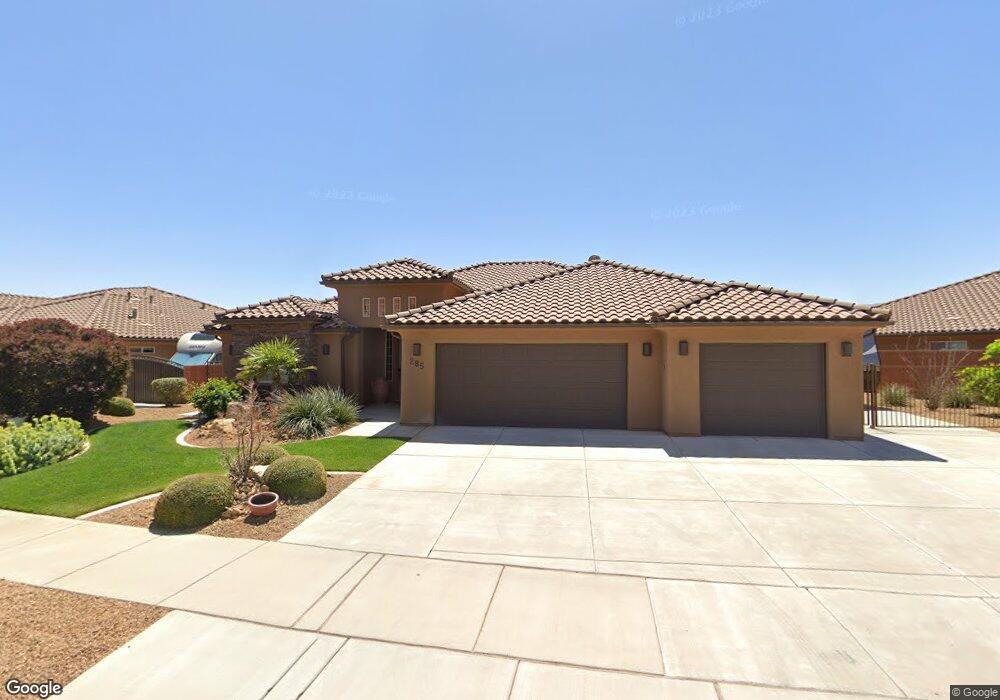
This home is located at 285 W Talon Ct, Ivins, UT 84738 and is currently estimated at $740,573, approximately $342 per square foot. 285 W Talon Ct is a home with nearby schools including Snow Canyon Middle School, Lava Ridge Intermediate School, and Snow Canyon High School.
Ownership History
Date
Name
Owned For
Owner Type
Purchase Details
Closed on
Apr 20, 2021
Sold by
Fox Richard Brent and Fox Tracy
Bought by
Noakes Craig and Noakes Maria C
Current Estimated Value
Home Financials for this Owner
Home Financials are based on the most recent Mortgage that was taken out on this home.
Original Mortgage
$250,000
Outstanding Balance
$225,900
Interest Rate
3.05%
Mortgage Type
New Conventional
Estimated Equity
$514,673
Purchase Details
Closed on
Mar 21, 2014
Sold by
Fox Brent
Bought by
Fox Richard Brent and Fox Tracy
Purchase Details
Closed on
Apr 26, 2013
Sold by
Ence Bros Construction Inc
Bought by
Fox Brent
Purchase Details
Closed on
Jan 23, 2013
Sold by
Macro Llc
Bought by
Ence Bros Construction Inc
Home Financials for this Owner
Home Financials are based on the most recent Mortgage that was taken out on this home.
Original Mortgage
$162,300
Interest Rate
3.28%
Mortgage Type
Purchase Money Mortgage
Create a Home Valuation Report for This Property
The Home Valuation Report is an in-depth analysis detailing your home's value as well as a comparison with similar homes in the area
Home Values in the Area
Average Home Value in this Area
Purchase History
| Date | Buyer | Sale Price | Title Company |
|---|---|---|---|
| Noakes Craig | -- | Cottonwood Title | |
| Fox Richard Brent | -- | None Available | |
| Fox Brent | -- | Southern Utah Title | |
| Ence Bros Construction Inc | -- | Southern Utah Title |
Source: Public Records
Mortgage History
| Date | Status | Borrower | Loan Amount |
|---|---|---|---|
| Open | Noakes Craig | $250,000 | |
| Previous Owner | Ence Bros Construction Inc | $162,300 |
Source: Public Records
Tax History Compared to Growth
Tax History
| Year | Tax Paid | Tax Assessment Tax Assessment Total Assessment is a certain percentage of the fair market value that is determined by local assessors to be the total taxable value of land and additions on the property. | Land | Improvement |
|---|---|---|---|---|
| 2025 | $4,179 | $642,100 | $185,000 | $457,100 |
| 2023 | $4,174 | $611,600 | $115,000 | $496,600 |
| 2022 | $4,352 | $600,400 | $115,000 | $485,400 |
| 2021 | $4,306 | $485,300 | $90,000 | $395,300 |
| 2020 | $3,946 | $421,000 | $85,000 | $336,000 |
| 2019 | $3,985 | $415,700 | $85,000 | $330,700 |
| 2018 | $3,872 | $377,900 | $0 | $0 |
| 2017 | $3,699 | $351,200 | $0 | $0 |
| 2016 | $3,767 | $330,400 | $0 | $0 |
| 2015 | $3,875 | $327,100 | $0 | $0 |
| 2014 | $3,849 | $326,500 | $0 | $0 |
Source: Public Records
Map
Nearby Homes
- 88 N Apex Ln
- 469 N Bur Sage Trail
- 480 W Tonapah Way
- 310 N Main St
- 140 W Center St Unit 20
- 539 N Bur Sage Trail
- 108 N Arrowhead Ln
- 576 W 30 S
- 97 S 495 W
- Deacon Plan at Desert Cove
- Darius Plan at Desert Cove
- 727 W Desert View Dr
- Harris Plan at Desert Cove
- Powell Plan at Desert Cove
- Pinecrest Plan at Desert Cove
- 19 N 640 W
- 782 E Crimson Flare Ln Unit 30
- 782 E Crimson Flare Ln
- 699 E Crimson Flare Ln
- 704 E Crimson Flare Ln Unit 2
- 281 W Talon Way
- 200 W N A
- 273 W Talon Ct
- 255 W Talon Ct
- 239 W Talon Way
- 301 W Talon Ct
- 270 W Talon Ct
- 288 W Talon Ct
- 311 W Talon Ct
- 256 W Talon Ct
- 262 W Altura Way
- 251 W Talon Ct
- 252 N Eagle Cove
- 323 W Talon Way
- 323 W Talon Ct
- 244 W Talon Ct
- 0 Red Stone Estates Lot #7
- 299 W Pheasant Ct
- 171 N Altura Way
- 283 W Pheasant Ct