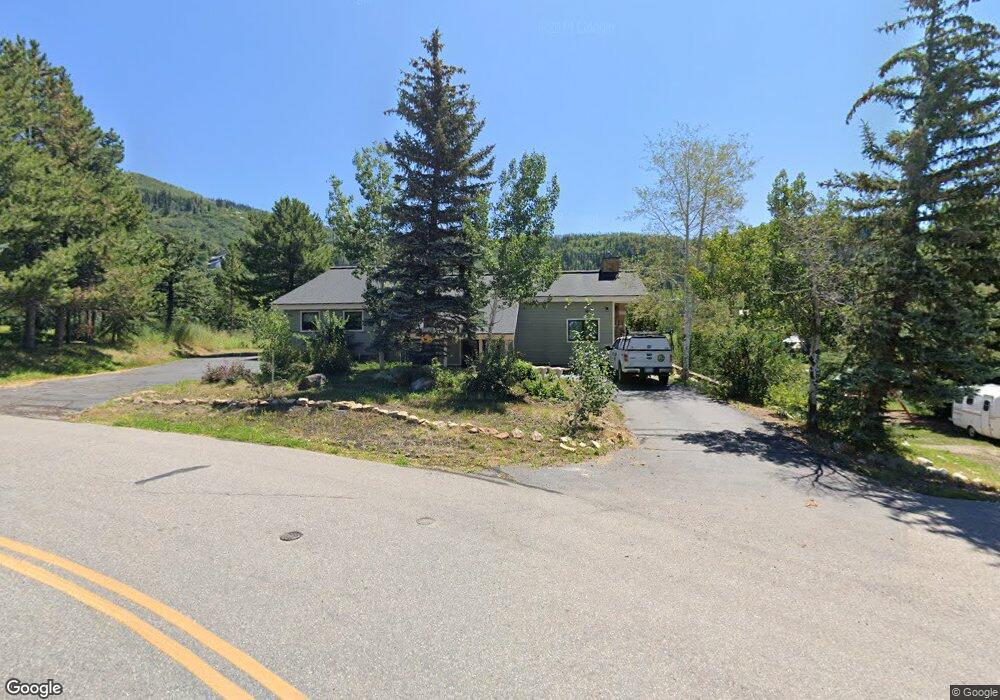
2850 Alpen Glow Way Steamboat Springs, CO 80487
Estimated Value: $1,234,000 - $2,356,234
6
Beds
4
Baths
3,458
Sq Ft
$508/Sq Ft
Est. Value
About This Home
This home is located at 2850 Alpen Glow Way, Steamboat Springs, CO 80487 and is currently estimated at $1,758,309, approximately $508 per square foot. 2850 Alpen Glow Way is a home located in Routt County with nearby schools including Strawberry Park Elementary School, Steamboat Springs Middle School, and Steamboat Springs High School.
Ownership History
Date
Name
Owned For
Owner Type
Purchase Details
Closed on
Dec 1, 2021
Sold by
Aaa Eagle Limited Partnership
Bought by
Jacobson Sita Rose and Moulton Ea R
Current Estimated Value
Purchase Details
Closed on
Feb 16, 2021
Sold by
Jacobson Kai
Bought by
Moulton Ea and Moulton Thomas
Purchase Details
Closed on
Feb 14, 2012
Sold by
Jacobson Ea and Jacobson Kai
Bought by
Moutlon Ea
Home Financials for this Owner
Home Financials are based on the most recent Mortgage that was taken out on this home.
Original Mortgage
$425,600
Interest Rate
3.93%
Mortgage Type
New Conventional
Purchase Details
Closed on
May 18, 2005
Sold by
Rogers Brian D
Bought by
Jacobson Kai
Create a Home Valuation Report for This Property
The Home Valuation Report is an in-depth analysis detailing your home's value as well as a comparison with similar homes in the area
Home Values in the Area
Average Home Value in this Area
Purchase History
| Date | Buyer | Sale Price | Title Company |
|---|---|---|---|
| Jacobson Sita Rose | $310,000 | Fidelity National Title | |
| Moulton Ea | -- | None Available | |
| Moutlon Ea | -- | Land Title Guarantee Company | |
| Jacobson Kai | $610,000 | None Available |
Source: Public Records
Mortgage History
| Date | Status | Borrower | Loan Amount |
|---|---|---|---|
| Previous Owner | Moulton Ea | $572,000 | |
| Previous Owner | Moulton Ea | $63,750 | |
| Previous Owner | Moulton Ea | $517,500 | |
| Previous Owner | Moulton Ea | $97,300 | |
| Previous Owner | Moutlon Ea | $425,600 |
Source: Public Records
Tax History Compared to Growth
Tax History
| Year | Tax Paid | Tax Assessment Tax Assessment Total Assessment is a certain percentage of the fair market value that is determined by local assessors to be the total taxable value of land and additions on the property. | Land | Improvement |
|---|---|---|---|---|
| 2024 | $4,590 | $109,490 | $45,370 | $64,120 |
| 2023 | $4,590 | $109,490 | $45,370 | $64,120 |
| 2022 | $3,249 | $58,870 | $23,800 | $35,070 |
| 2021 | $3,382 | $61,910 | $25,030 | $36,880 |
| 2020 | $3,427 | $63,190 | $28,600 | $34,590 |
| 2019 | $3,343 | $63,190 | $0 | $0 |
| 2018 | $2,953 | $59,170 | $0 | $0 |
| 2017 | $2,916 | $59,170 | $0 | $0 |
| 2016 | $2,695 | $59,270 | $31,840 | $27,430 |
| 2015 | $2,637 | $59,270 | $31,840 | $27,430 |
| 2014 | $2,655 | $57,080 | $31,840 | $25,240 |
| 2012 | -- | $65,660 | $31,840 | $33,820 |
Source: Public Records
Map
Nearby Homes
- 2180 Val Disere Cir
- 3185 Apres Ski Way
- 2927 Laurel Ln
- 2495 Val D'Isere Cir
- 2415 Val Disere Cir
- 2300 Val D'Isere Cir
- 2075 Walton Creek Rd Unit 2B
- 2800 Laurel Ln
- 2663 Apres Ski Way Unit 6
- 3315 Columbine Dr Unit 1307
- TBD Ski Trail Ln
- 3295 Apres Ski Way Unit B10
- 3295 Apres Ski Way Unit B4
- 3295 Apres Ski Way Unit A3
- 3295 Apres Ski Way Unit B9
- 3025 Columbine Dr Unit 30
- 2020 Bear Dr
- 2025 Walton Creek Rd Unit 315
- 2025 Walton Creek Rd Unit 407
- 2583 Apres Ski Way Unit 4
- 2880 Alpenglow Way
- 2835 Alpenglow Way
- 2555 Val Disere Cir
- 2835 Alpen Glow Way
- 2880 Alpen Glow Way
- 2860 Alpen Glow Way
- 2800 Alpen Glow Way
- 2830 Alpen Glow Way
- 2551 Val Disere Cir
- 2910 Alpenglow Way
- 2910 Alpen Glow Way
- 2553 Val Disere Cir
- tbd Alpenglow Way
- 2925 Alpen Glow Way
- 2595 Val Disere Cir
- 2597 Val Disere Cir
- 2595 Val D'Isere Cir
- 2165 Val Disere Cir
- 2777 Alpen Glow Way
- 2777 Alpen Glow Way Unit LOT 2 ALPENGLOW TOH