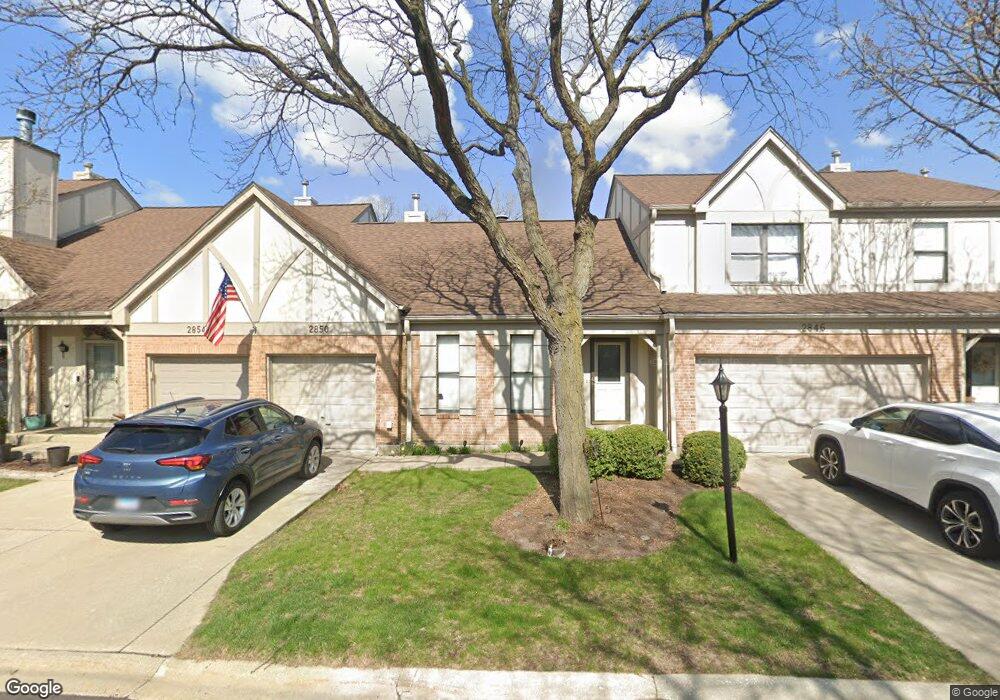
2850 Brighton Ct Westchester, IL 60154
Estimated Value: $308,000 - $335,000
2
Beds
2
Baths
1,320
Sq Ft
$244/Sq Ft
Est. Value
About This Home
This home is located at 2850 Brighton Ct, Westchester, IL 60154 and is currently estimated at $322,023, approximately $243 per square foot. 2850 Brighton Ct is a home located in Cook County with nearby schools including Westchester Primary School, Westchester Intermediate School, and Westchester Middle School.
Ownership History
Date
Name
Owned For
Owner Type
Purchase Details
Closed on
May 28, 2019
Sold by
Gronowski Gregory E and Gronowski Theresa M
Bought by
Gronowski Gregory E
Current Estimated Value
Purchase Details
Closed on
Mar 25, 2011
Sold by
Mazzel Lee Ann
Bought by
Gronowski Gregory E and Gronowski Theresa M
Home Financials for this Owner
Home Financials are based on the most recent Mortgage that was taken out on this home.
Original Mortgage
$177,386
Outstanding Balance
$121,652
Interest Rate
4.75%
Mortgage Type
FHA
Estimated Equity
$200,371
Purchase Details
Closed on
Jul 2, 1999
Sold by
Vega Lorraine J
Bought by
Vega Lorraine J and Mazzei Lee Ann
Purchase Details
Closed on
Jul 1, 1999
Sold by
Vega Lorraine J and Vega Gene
Bought by
Vega Lorraine J and Gene Vega Marital Trust
Purchase Details
Closed on
Aug 9, 1997
Sold by
Vega Gene A and Vega Lorraine J
Bought by
Vega Gene and Gene Vega Declaration Of Trust
Create a Home Valuation Report for This Property
The Home Valuation Report is an in-depth analysis detailing your home's value as well as a comparison with similar homes in the area
Home Values in the Area
Average Home Value in this Area
Purchase History
| Date | Buyer | Sale Price | Title Company |
|---|---|---|---|
| Gronowski Gregory E | -- | Citywide Title Corporation | |
| Gronowski Gregory E | $182,000 | Stewart Title Company | |
| Vega Lorraine J | -- | -- | |
| Vega Lorraine J | -- | -- | |
| Vega Gene | -- | -- |
Source: Public Records
Mortgage History
| Date | Status | Borrower | Loan Amount |
|---|---|---|---|
| Open | Gronowski Gregory E | $177,386 |
Source: Public Records
Tax History Compared to Growth
Tax History
| Year | Tax Paid | Tax Assessment Tax Assessment Total Assessment is a certain percentage of the fair market value that is determined by local assessors to be the total taxable value of land and additions on the property. | Land | Improvement |
|---|---|---|---|---|
| 2024 | $5,691 | $25,001 | $1,823 | $23,178 |
| 2023 | $5,467 | $25,001 | $1,823 | $23,178 |
| 2022 | $5,467 | $21,343 | $2,066 | $19,277 |
| 2021 | $5,319 | $21,341 | $2,065 | $19,276 |
| 2020 | $5,262 | $21,341 | $2,065 | $19,276 |
| 2019 | $4,556 | $19,558 | $1,883 | $17,675 |
| 2018 | $4,495 | $19,558 | $1,883 | $17,675 |
| 2017 | $4,425 | $19,558 | $1,883 | $17,675 |
| 2016 | $4,899 | $19,296 | $1,701 | $17,595 |
| 2015 | $4,800 | $19,296 | $1,701 | $17,595 |
| 2014 | $4,705 | $19,296 | $1,701 | $17,595 |
| 2013 | $4,307 | $17,133 | $1,701 | $15,432 |
Source: Public Records
Map
Nearby Homes
- 16 Princess Ct Unit 16
- 2925 Denton Ct
- 10916 Kingston St
- 3036 Downing Ave
- 11140 Windsor Dr
- 2401 Mayfair Ave
- 2610 Sunnyside Ave
- 2623 Sunnyside Ave
- 2337 Kensington Ave
- 2228 High Ridge Pkwy
- 11449 Prescott Ln
- 2550 Camberley Cir Unit 5-810
- 10610 Essex St
- 11513 Enterprise Dr
- 10511 Preston St
- 2230 Kensington Ave
- 2130 Mandel Ave
- 2205 Mayfair Ave
- 11148 Shelley St
- 1948 Boeger Ave
- 2854 Brighton Ct
- 2846 Brighton Ct
- 2858 Brighton Ct
- 2842 Brighton Ct
- 2862 Brighton Ct
- 2838 Brighton Ct
- 2851 Brighton Ct
- 2855 Brighton Ct
- 2847 Brighton Ct
- 2834 Brighton Ct
- 2859 Brighton Ct
- 11028 Westminster Dr
- 11034 Westminster Dr
- 11038 Westminster Dr
- 2863 Brighton Ct
- 2830 Brighton Ct
- 11042 Westminster Dr
- 2800 Denton Ct
- 2800 Denton Ct Unit 2800
- 11046 Westminster Dr