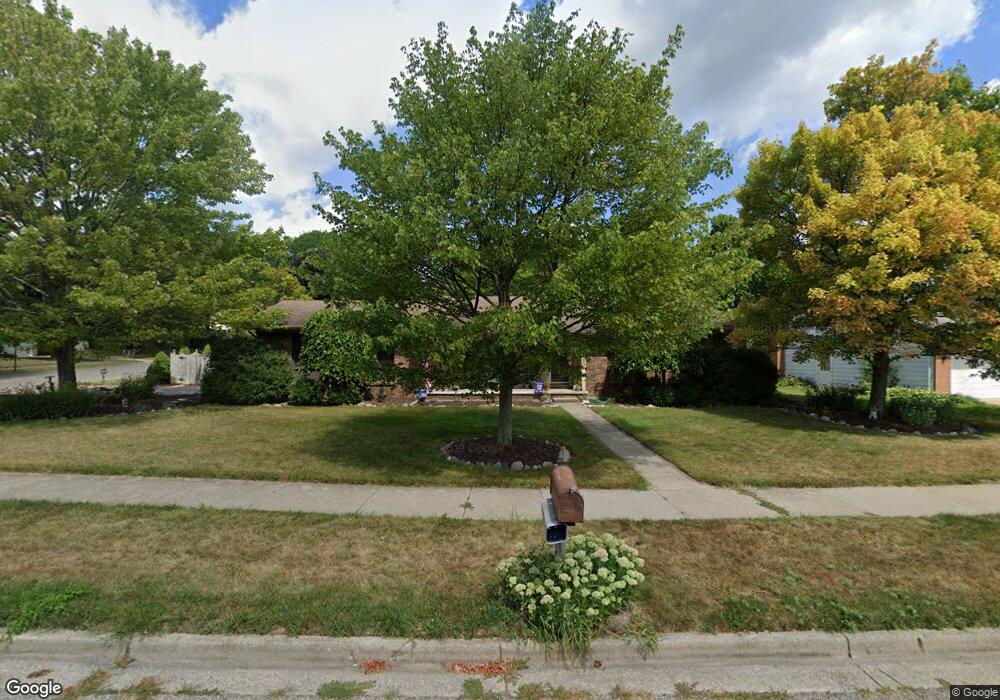
2850 Buglers Way East Lansing, MI 48823
Estimated Value: $331,794 - $414,000
3
Beds
3
Baths
1,677
Sq Ft
$215/Sq Ft
Est. Value
About This Home
This home is located at 2850 Buglers Way, East Lansing, MI 48823 and is currently estimated at $360,949, approximately $215 per square foot. 2850 Buglers Way is a home located in Ingham County with nearby schools including Donley Elementary School, MacDonald Middle School, and East Lansing High School.
Ownership History
Date
Name
Owned For
Owner Type
Purchase Details
Closed on
Feb 19, 2002
Sold by
Christenson David R and Christenson Debra D
Bought by
Petroff Joseph M and Petroff Kristi Lysik
Current Estimated Value
Home Financials for this Owner
Home Financials are based on the most recent Mortgage that was taken out on this home.
Original Mortgage
$147,900
Outstanding Balance
$58,164
Interest Rate
6.37%
Mortgage Type
Purchase Money Mortgage
Estimated Equity
$302,785
Purchase Details
Closed on
Nov 13, 2000
Sold by
Schaberg Richard D and Schaberg Joy
Bought by
Christenson David R and Christenson Debra D
Home Financials for this Owner
Home Financials are based on the most recent Mortgage that was taken out on this home.
Original Mortgage
$150,000
Interest Rate
7.87%
Mortgage Type
Purchase Money Mortgage
Create a Home Valuation Report for This Property
The Home Valuation Report is an in-depth analysis detailing your home's value as well as a comparison with similar homes in the area
Home Values in the Area
Average Home Value in this Area
Purchase History
| Date | Buyer | Sale Price | Title Company |
|---|---|---|---|
| Petroff Joseph M | $174,000 | First American Title Ins Co | |
| Christenson David R | $140,000 | -- |
Source: Public Records
Mortgage History
| Date | Status | Borrower | Loan Amount |
|---|---|---|---|
| Open | Petroff Joseph M | $147,900 | |
| Previous Owner | Christenson David R | $150,000 |
Source: Public Records
Tax History Compared to Growth
Tax History
| Year | Tax Paid | Tax Assessment Tax Assessment Total Assessment is a certain percentage of the fair market value that is determined by local assessors to be the total taxable value of land and additions on the property. | Land | Improvement |
|---|---|---|---|---|
| 2025 | $5,037 | $139,900 | $34,900 | $105,000 |
| 2024 | $25 | $131,800 | $33,200 | $98,600 |
| 2023 | $4,748 | $121,400 | $32,500 | $88,900 |
| 2022 | $4,562 | $113,300 | $33,700 | $79,600 |
| 2021 | $4,563 | $107,600 | $32,000 | $75,600 |
| 2020 | $4,369 | $105,000 | $32,000 | $73,000 |
| 2019 | $4,227 | $95,900 | $29,700 | $66,200 |
| 2018 | $4,079 | $87,700 | $30,100 | $57,600 |
| 2017 | $3,900 | $86,200 | $30,100 | $56,100 |
| 2016 | $2,119 | $82,100 | $30,400 | $51,700 |
| 2015 | $2,119 | $76,300 | $54,632 | $21,668 |
| 2014 | $2,119 | $76,700 | $57,011 | $19,689 |
Source: Public Records
Map
Nearby Homes
- 0 Hagadorn Lot D Rd
- 5900 N Hagadorn Rd
- 0 Hagadorn Lot C Rd Unit 50193276
- 1539 N Hagadorn Rd Unit 1A
- 6160 Innkeepers Ct Unit 57
- 1531 Winchell Ct
- 3021 Birch Row Dr Unit 9
- 6165 Innkeepers Ct Unit 76
- 1544 Haslett Rd
- 1351 Foxcroft Rd
- 0 Birch Row Dr
- 6004 Gibson Ave
- 6097 Southridge Rd
- 1511 Dennison Rd
- 1719 Woodside Dr
- 6327 Skyline Dr
- 5604 Deville Ct
- 894 Lenna Keith Cir
- 933 Bedford Rd
- 5680 Deville Ct Unit 61
- 2840 Buglers Way
- 5990 Highgate Ave
- 2832 Buglers Way
- 5985 Highgate Ave
- 5952 Highgate Ave Unit 9
- 5998 Highgate Ave
- 5975 Highgate Ave
- 2843 Buglers Way
- 2835 Buglers Way
- 5963 Highgate Ave
- 2826 Buglers Way
- 2875 E Lake Lansing Rd
- 5955 Highgate Ave
- 5940 Highgate Ave
- 2905 E Lake Lansing Rd
- 5939 Blythefield Dr
- 2831 E Lake Lansing Rd
- 2812 Buglers Way
- 5948 Blythefield Dr
- 5947 Highgate Ave